The Wright Brothers were the first to fly on this date in 1903. Growing up in southwest Ohio, we didn’t give a lot of credence to those floating other versions of history. It was Orville and Wilbur at Kitty Hawk on December 17. Full stop. While we’re at it, let’s not forget their mechanic Charles Taylor who patiently got them back into the air time after time. Coming from the world of bicycles, the Wrights used a chain drive to turn their propellers.
A few weeks back, I got engine data from an airplane powered by two Lycoming IO-390 engines and data from a Dynon Skyview. My rule about using data for a Puzzler is to identify the aircraft type and the engine type, but never use the N number. I’m sticking with that. The overspeed on this 390 isn’t a scenario that the typical 390 owner is likely to encounter, but in honor of first flight day I thought I would show you what happens when the chain breaks on a Wright B Flyer.
The ticket title was “Severe Engine overspeed, dieseling, and smoke” so it sort of had Puzzler written on it from the get-go. Plus, I was intrigued by the idea of being able to analyze data from a historic design using today’s technology. Our client wanted to take a close look at the moment of catastrophic failure of the chain to see the numbers. He also wanted us to look at the data before the failure and other recent flights for clues. Here’s data from the engine with the chain failure, with the cursor on the moment of failure.
EGTs on top, with CHTs, FF and oil pressure below.
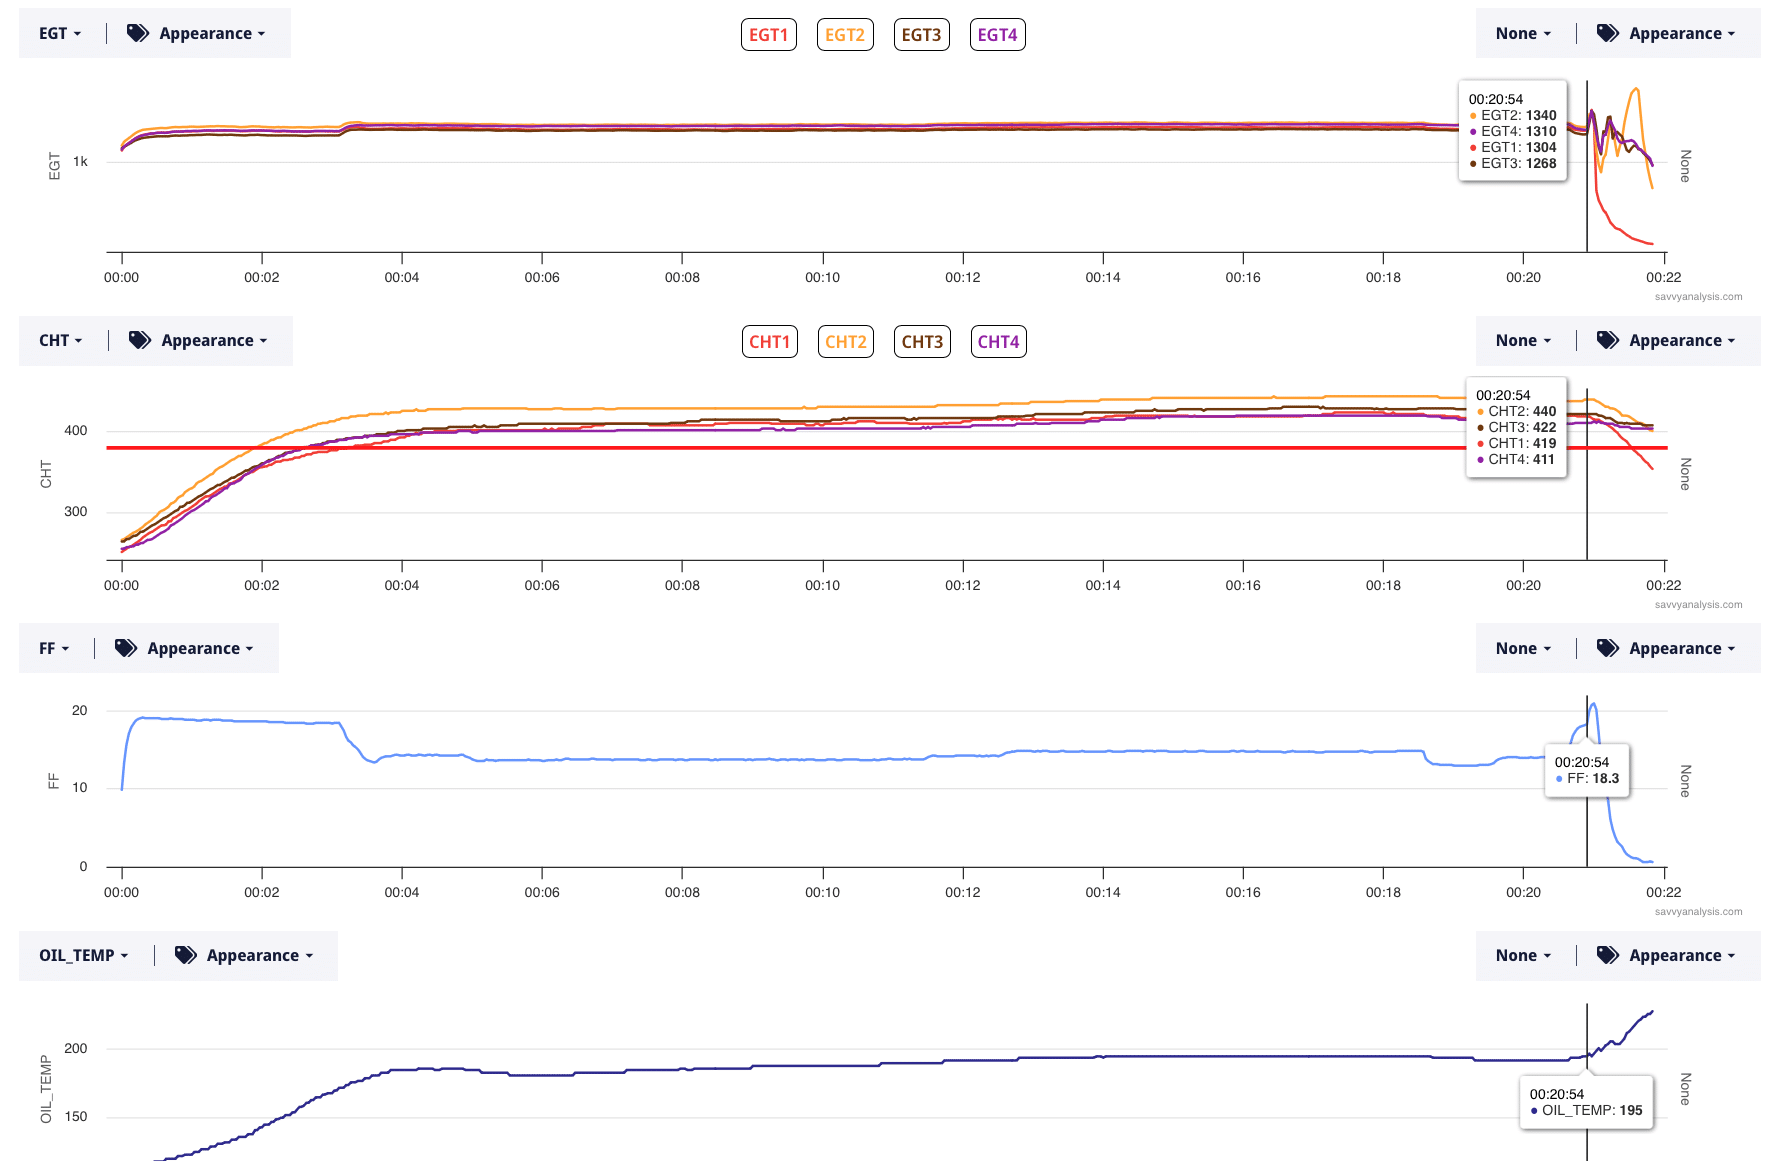
CHTs are too high, and that had been an issue for these engines for a while. The good news is these un-cowled engines are exposed to plenty of air – the bad news is that the IAS of about 50 knots is well below what they’re designed for.
Here’s the RPM trace for the same flight, with the cursor on of 5434. There was one reading of 5627.
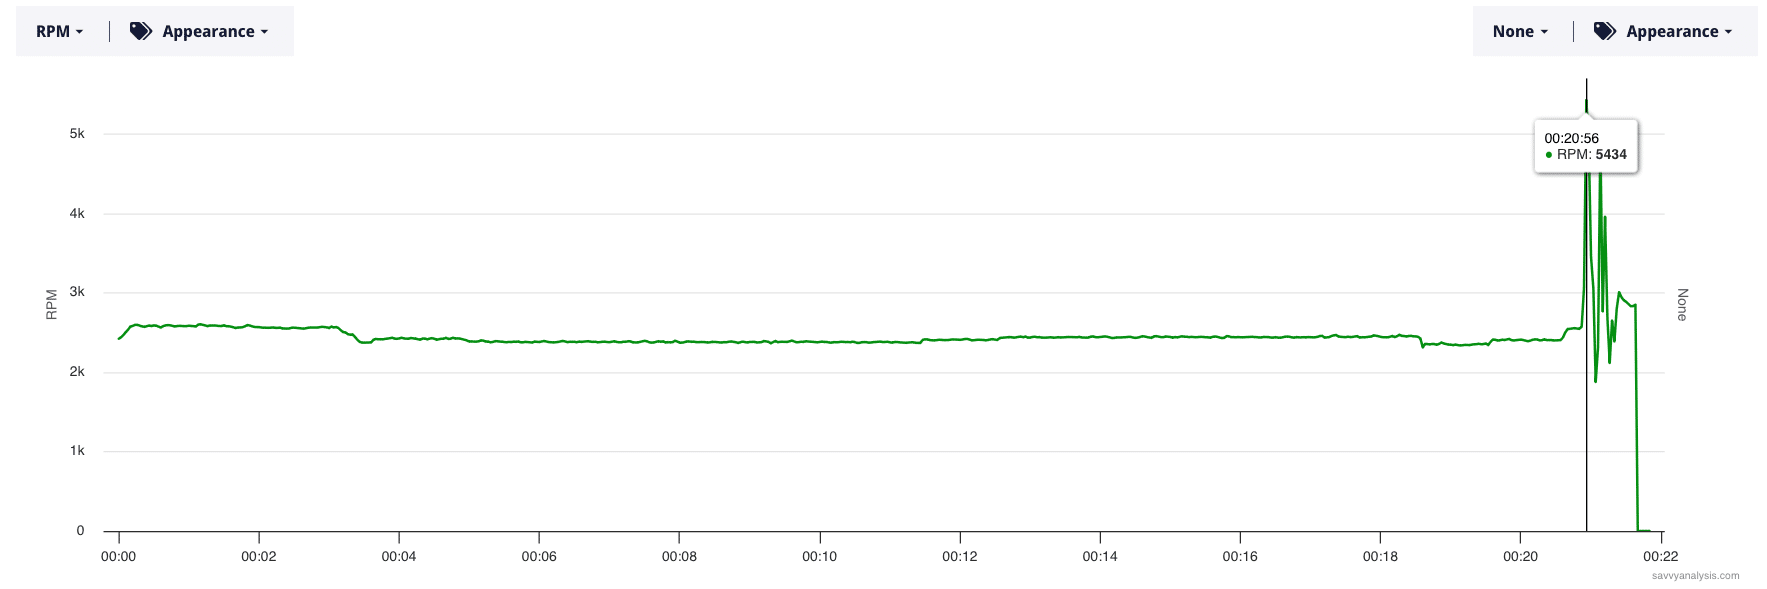
Here’s the same data zoomed into the failure. We thought if the chain had been malfunctioning we might see that in the RPM data. Reviewing the data from first 20 minutes of this flight, or in other recent flights, we didn’t see anything that would suggest impending chain failure.

Lycoming’s SB369 addresses overspeeds. Even their edge cases top out under 4000, so this Rotax-type number of 5434 is test-pilot stuff. Which brings us back to Orville, Wilbur and Charles.
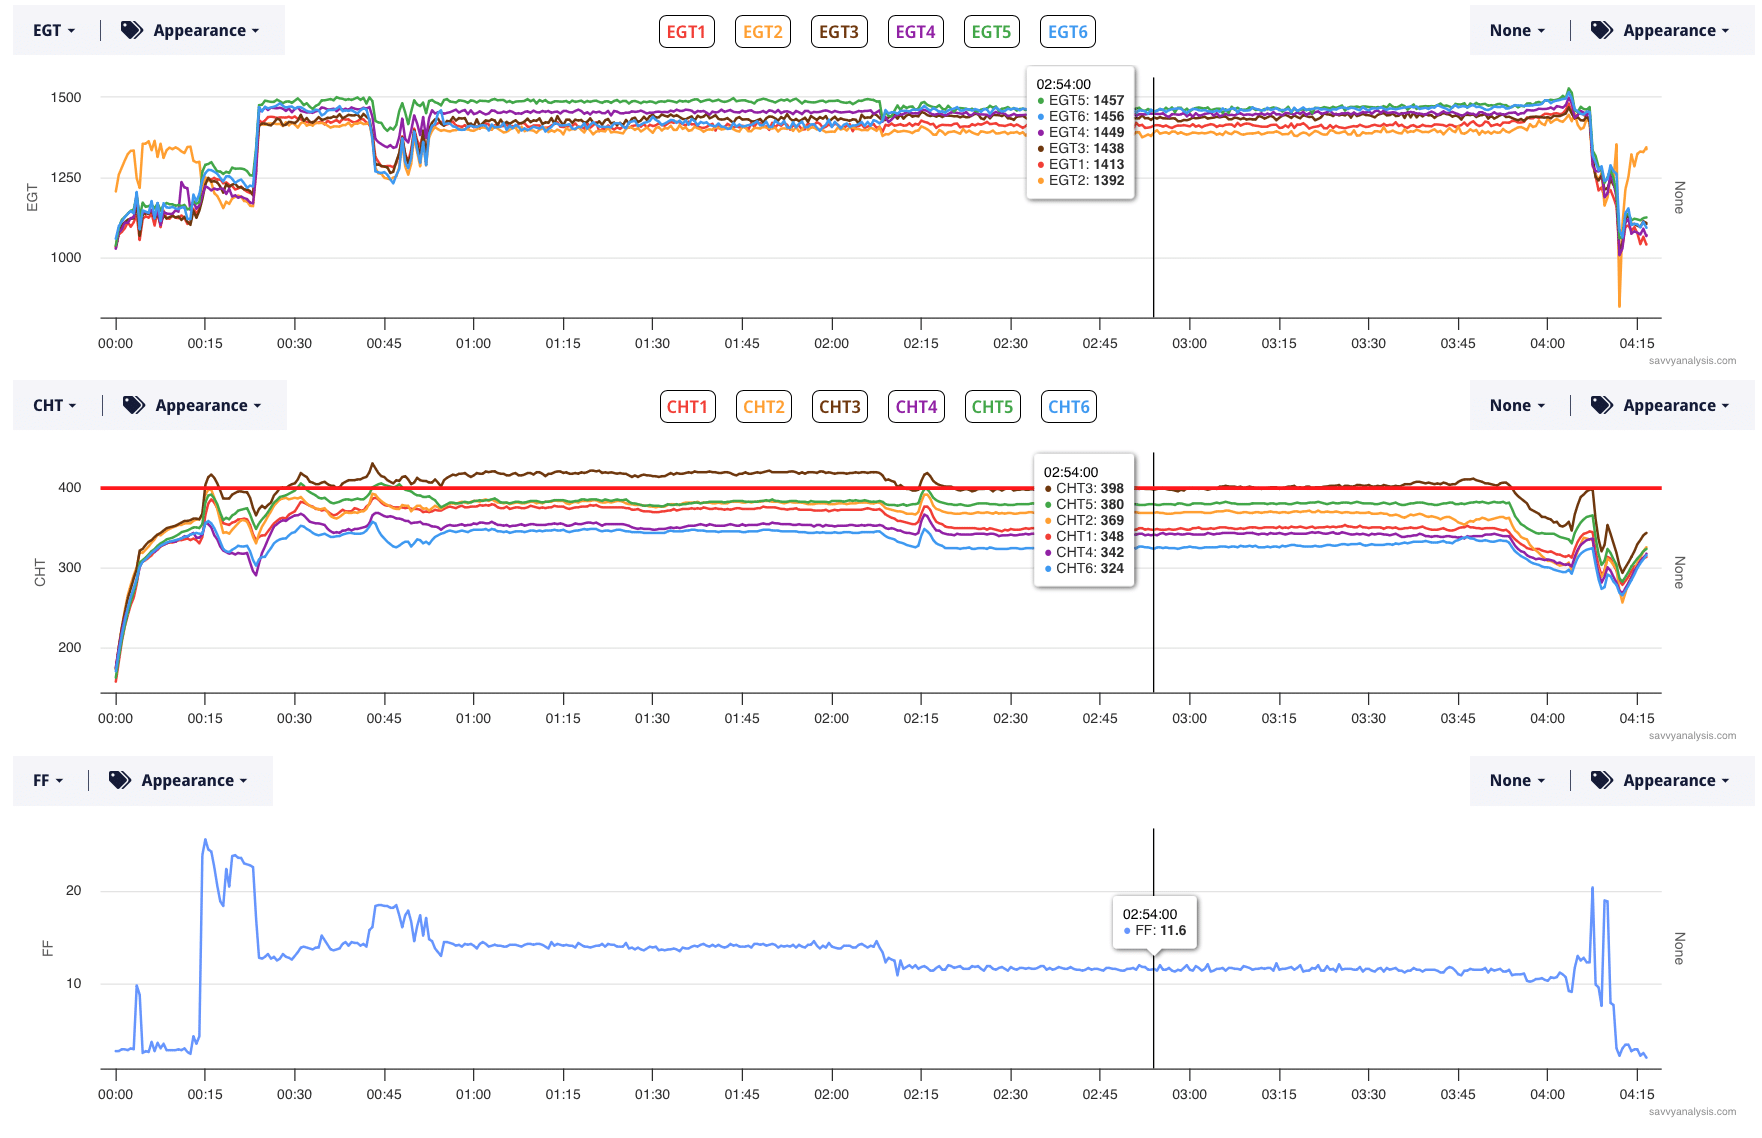
Next up is a Cessna TR–182 RG powered by a (carbureted) Lycoming O-540 with data from a JPI 830 with a 1 second sample rate. EGTs on top with CHTs and FF below. Something happens at the cursor, but it’s not reflected in any of these traces.
Here’s oil pressure, oil temp and altitude for the same flight. Cursor’s in the same spot.
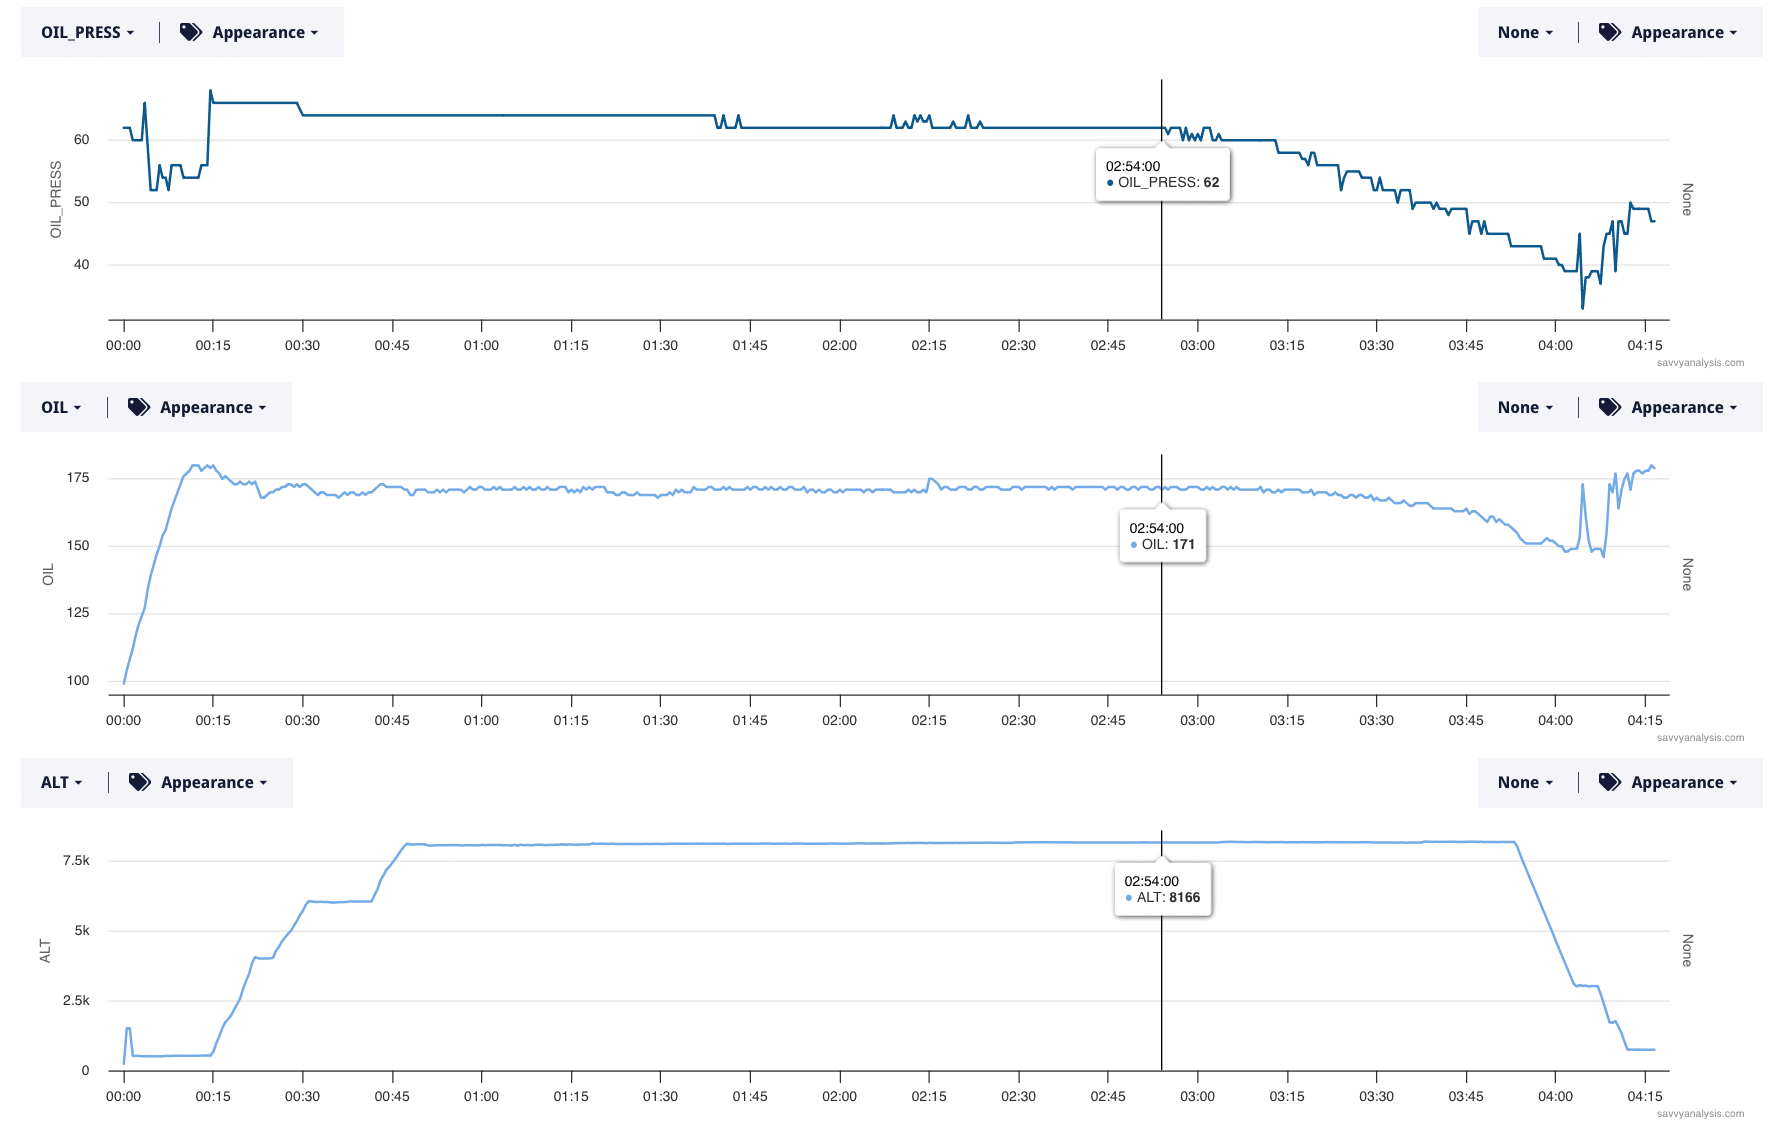
Oil pressure begins dropping at 02:54 in the timeline. A couple of things are worth mentioning about that. Oil temp doesn’t move right away. And when it moves, it doesn’t move as dramatically as oil pressure. And when it moves, it doesn’t rise. When I got my PPL many, many years ago, the CFI left me with the impression that if oil pressure is moving, but oil temperature is steady, then it must be a faulty oil pressure gauge. I’ve seen too many examples over the last 11 years where the oil pressure was dropping, and the engine just kept humming along – until it didn’t.
Here’s what happened. The vacuum pump got changed on this engine, and the mechanics loosened the oil hose to give themselves more room to work in. Evidently, that nut was never properly tightened and torque after the vacuum pump repair.
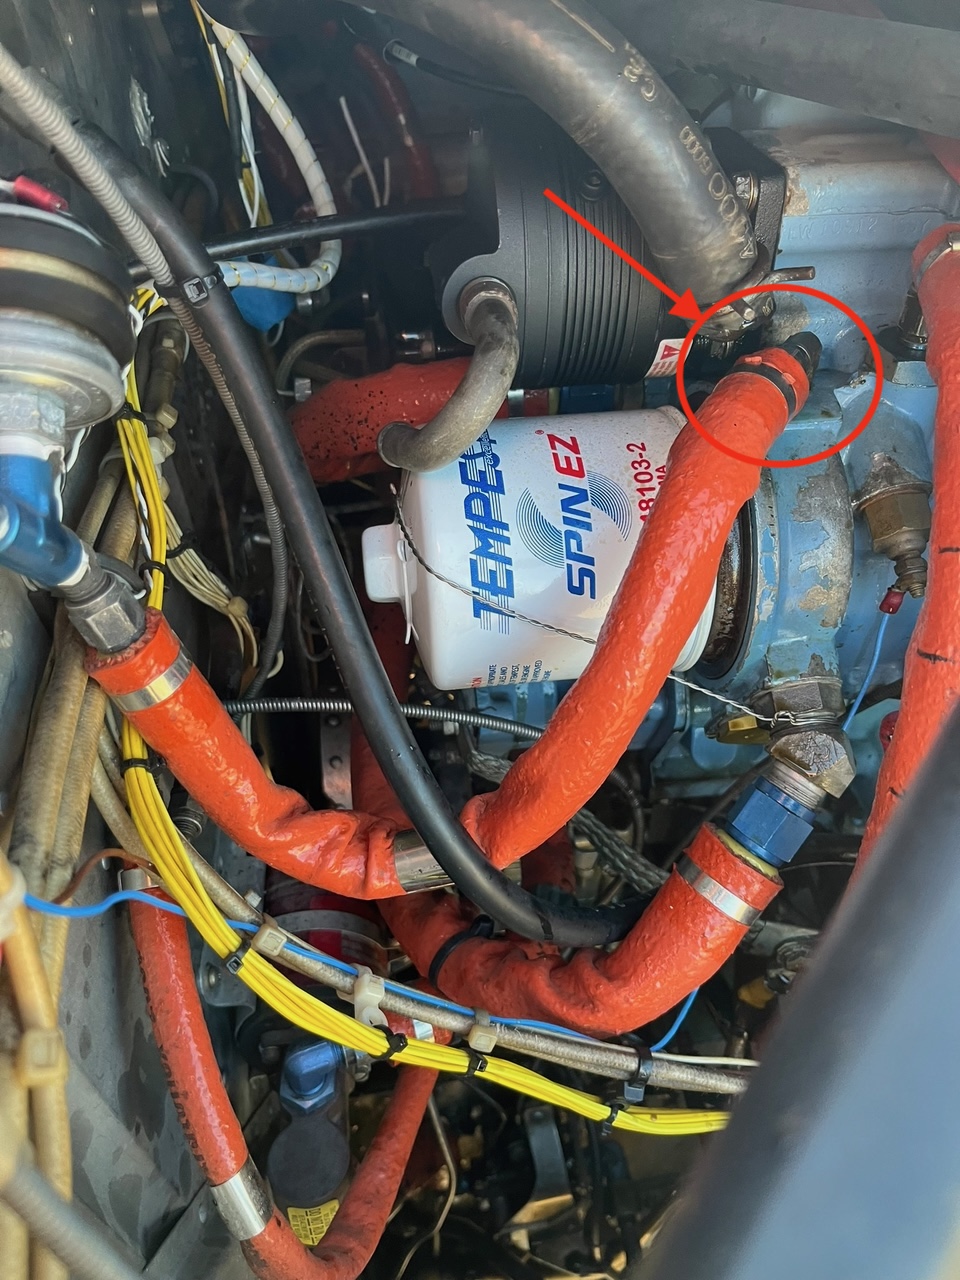
After the emergency landing, they found “copious amounts of oil on the cowl flap, right side gear leg and down the entire belly. Uncowling the engine we discovered oil everywhere on the right side and almost no oil on the dipstick.”
Next up is a Cirrus SR22 powered by a Continental IO-550 TN with the Tornado Alley conversion, and data from a Garmin Perspective with a 1 second sample rate. EGTs on top, with CHTs and FF below.
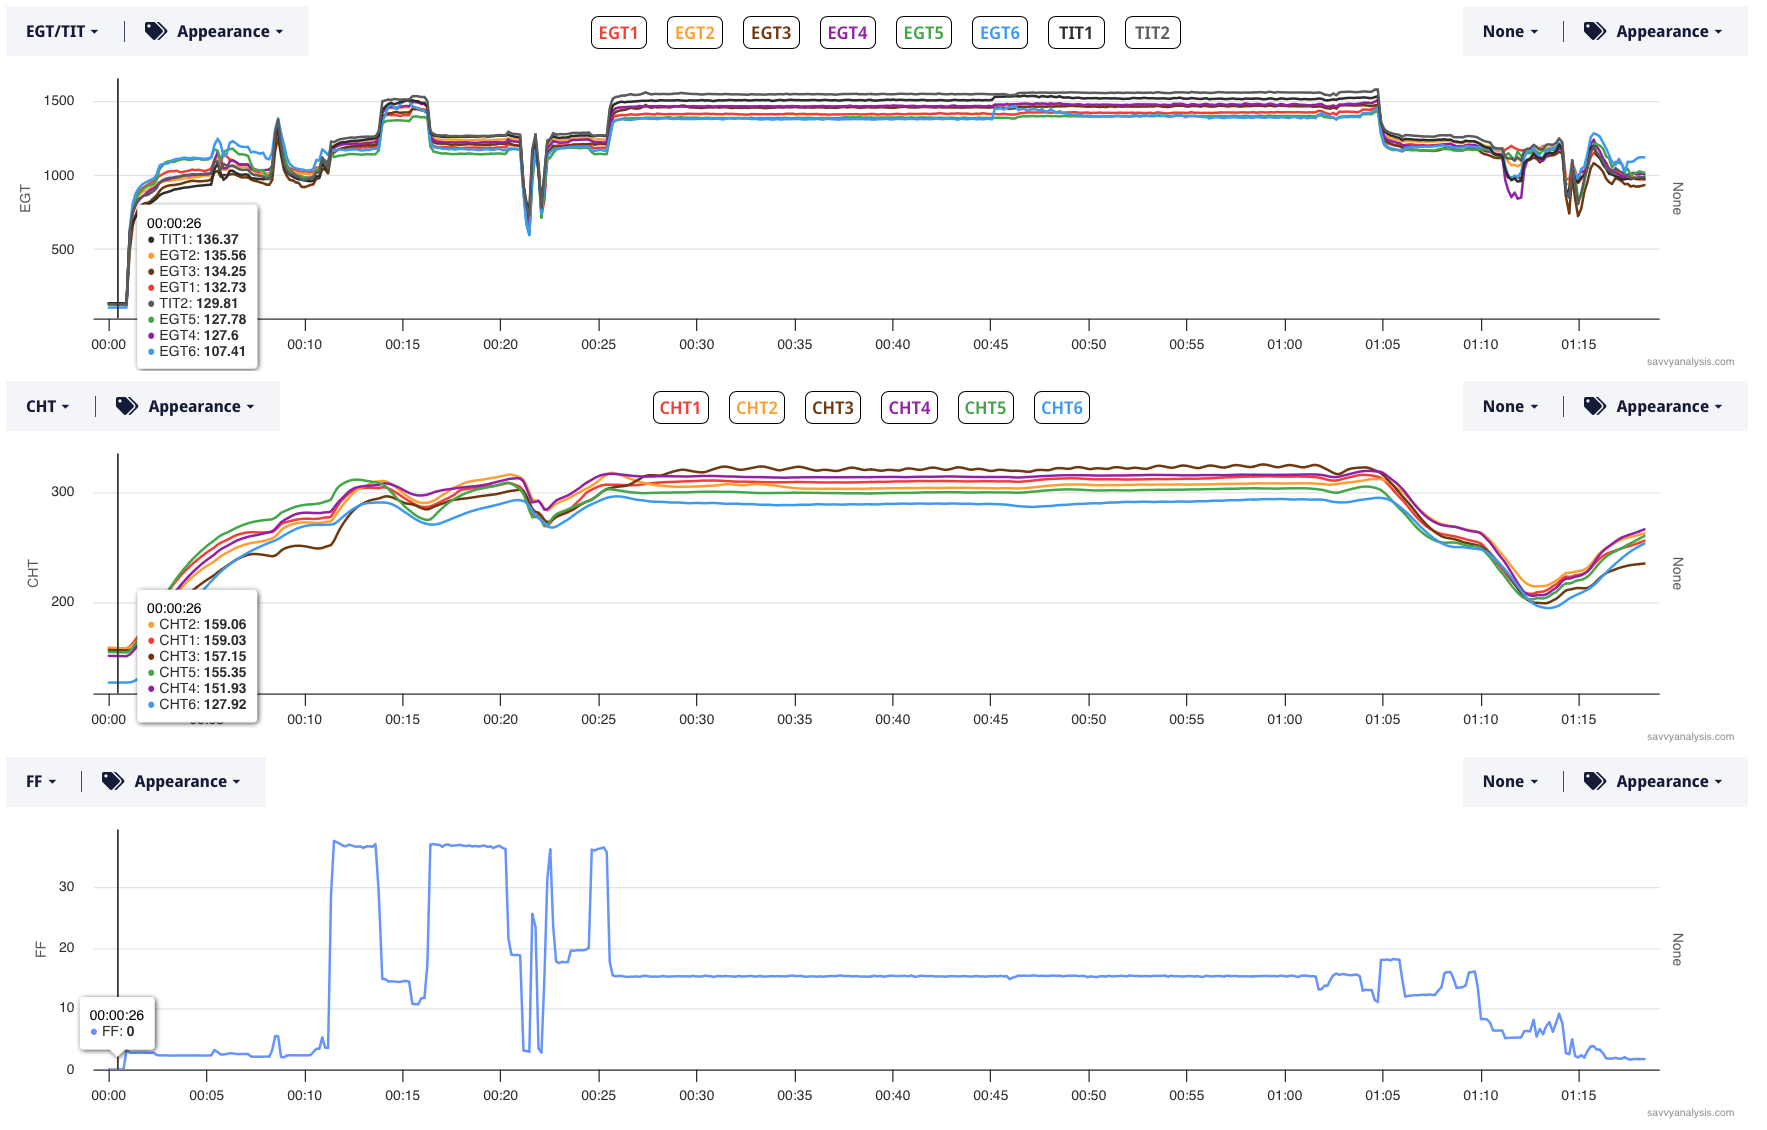
Looks pretty good, but our client mentioned a slight roughness starting around the 45 minute mark. In flight, he couldn’t tell if it was coming from the engine, the prop or the weather. Once he got on the ground and took a look at the data he saw an excursion in EGT6. Let’s take a closer look at that. I also used our ∆ tool to calculate the amount of the jump in EGT 6. That’s the 83.7º reading in the right column.

83º is right in the wheelhouse of the rise we expect when one of the plugs misfires. Notice it took TIT 1 up a little, too. The interesting thing here is that after that rise, the plug clears itself and returns to its previous range. The roughness would’ve lasted about five minutes. Good eye is you also noticed the wavy pattern in CHT 3 in the first screenshot. That is most likely caused by a baffle that’s slightly loose and moving with the incoming wind.
We’ll finish this year with a Cessna 421 powered by Continental GTSIO-520 engines and data from a Garmin 500 Txi with a 1 second sample rate. The G is for geared. The problem was with the R engine so here’s R engine EGTs and CHTs. Nothing special about cursor placement.
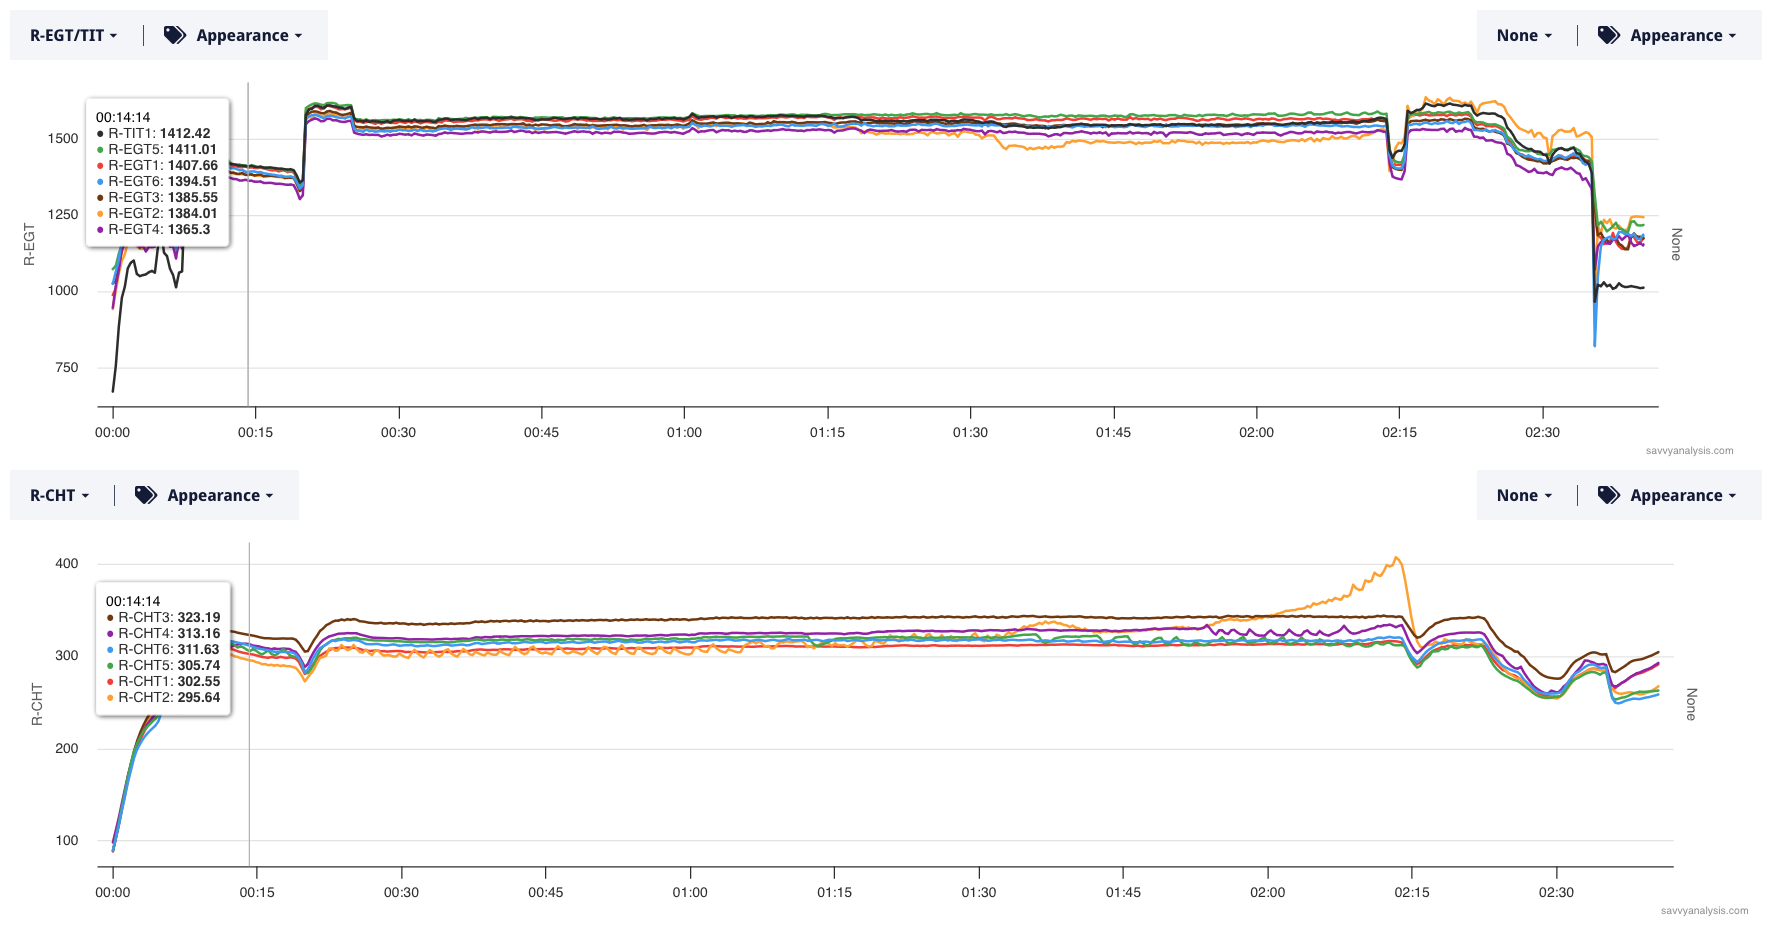
Let’s zoom into CHTs starting with the takeoff.
Altitude isn’t depicted but easy to describe – climb to 12,500 msl takes about 15 minutes and the plane stays there until the big CHT drop at 02:22. There is an on-course turn at about 52 minutes but neither heading nor altitude appear to be a factor in the variations in CHTs.
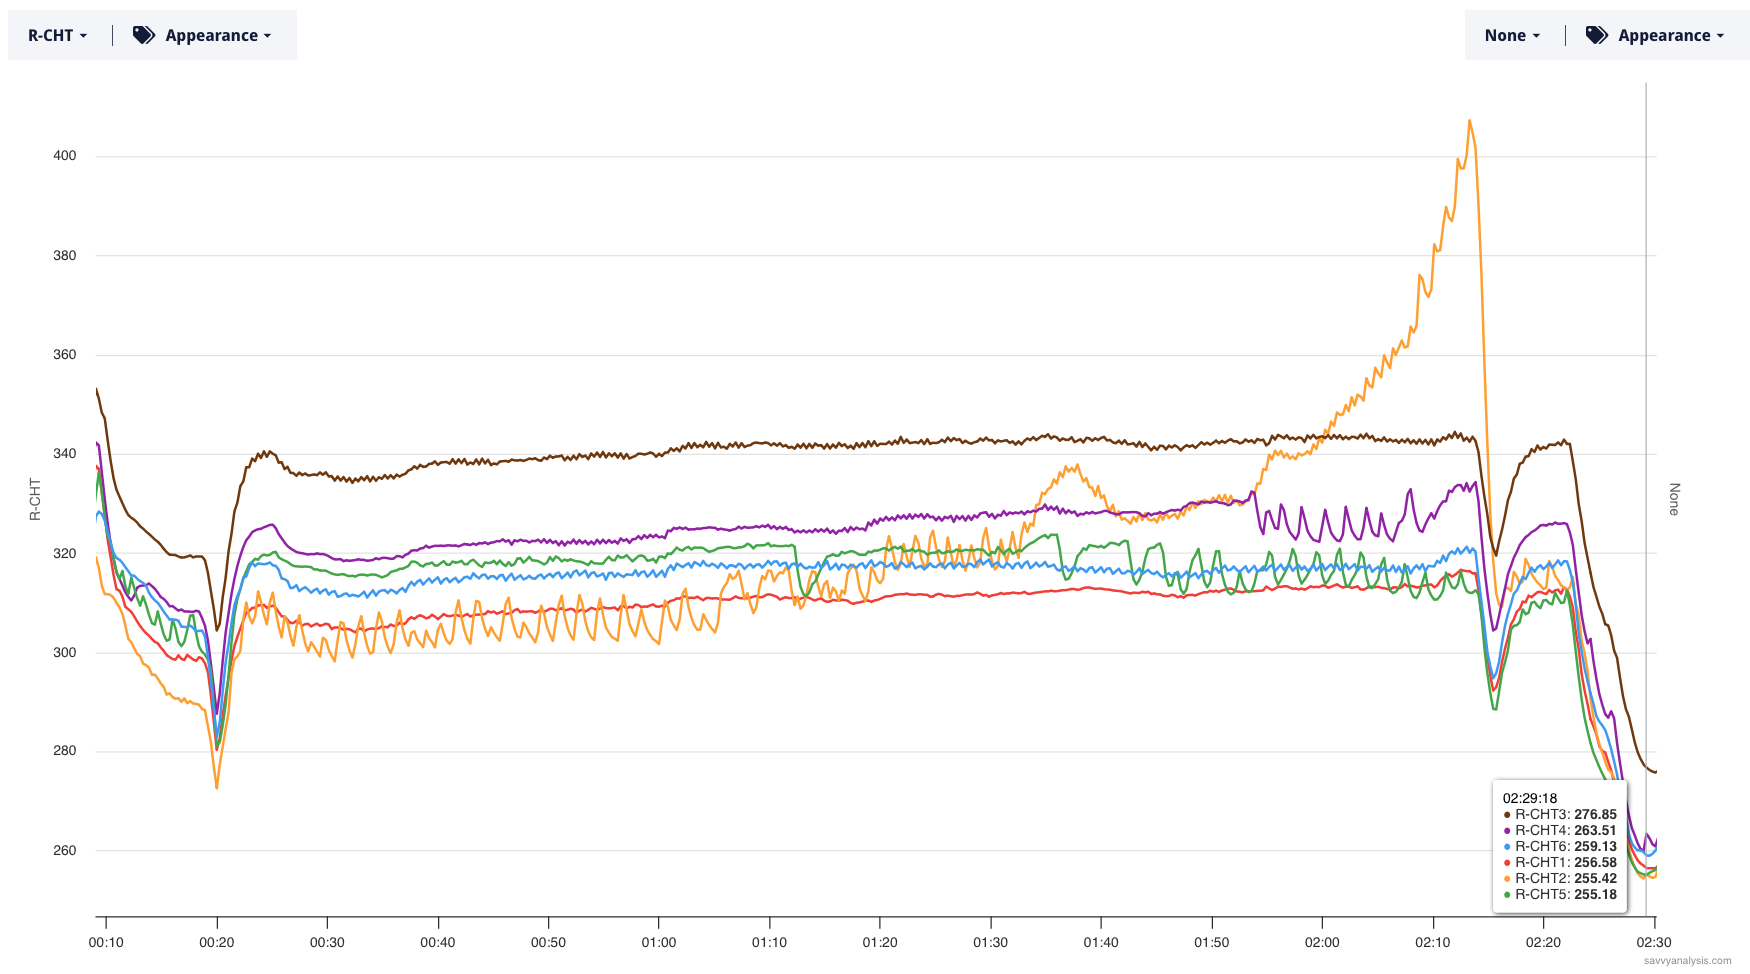
Lots of W and M shaped oscillations in multiple CHTs on both sides of the engine. The pattern for 5 starts in climb, goes away in initial cruise, then returns. The pattern for 4 doesn’t develop until 2 begins its big move. 2 – well, 2 is a mess ending in a pre-ignition event. We think it’s pre-ignition vs detonation because EGT 2 moves lower as CHT 2 rises.