It’s a January tradition to restate the mission of these Puzzlers. Our goal is to help pilots recognize data anomalies in real time to make good decisions about the safety of the flight, and help owners to make informed maintenance decisions.
Last January Savvy began our borescope initiative, including some background from Mike on the importance of boroscopy as a maintenance tool, guidance from Dave on how to take the pictures, and an online repository to store them. Even the most optimistic of us were thrilled that we ended the year with 87,000 borescope pictures.
Let’s start the year with a Piper Malibu powered by a Continental TSIO- 550 and data from a JPI 830 with a one second sample rate. This is a test profile flight.
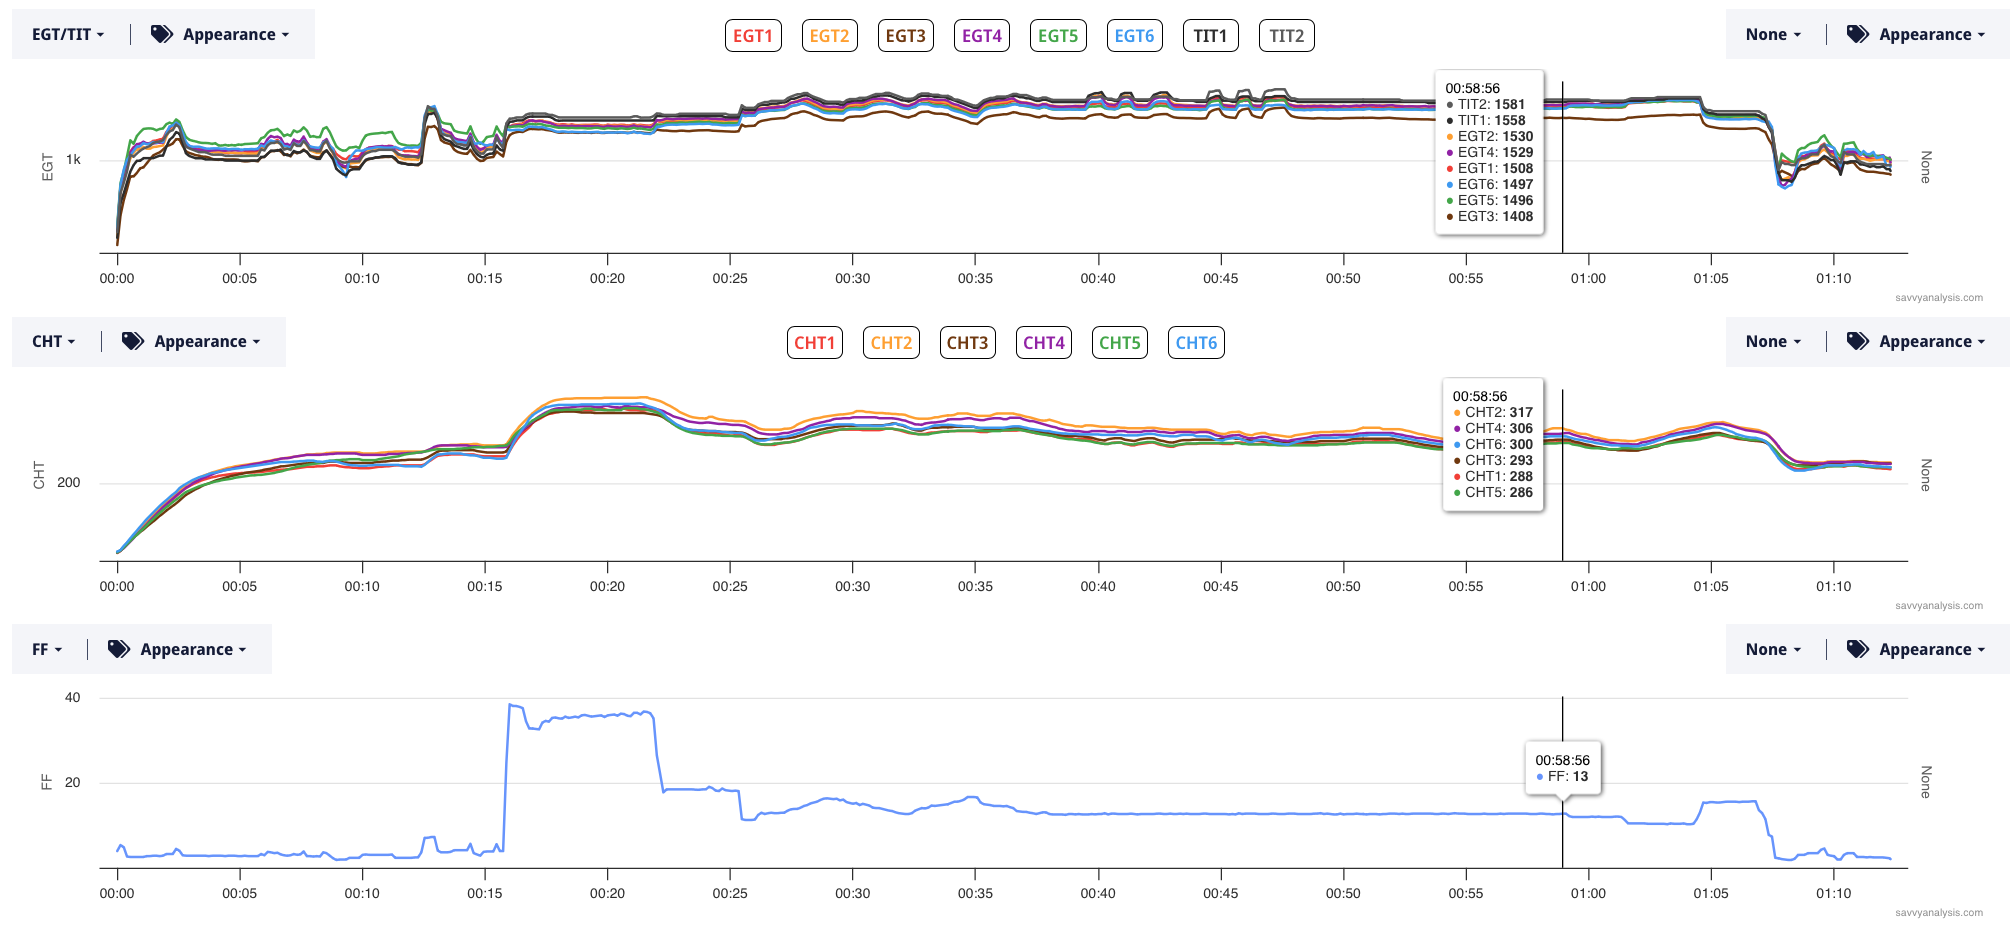
Let’s zoom into the mag checks after the mixture sweeps. And we’ll use the M button to switch to mag check display.
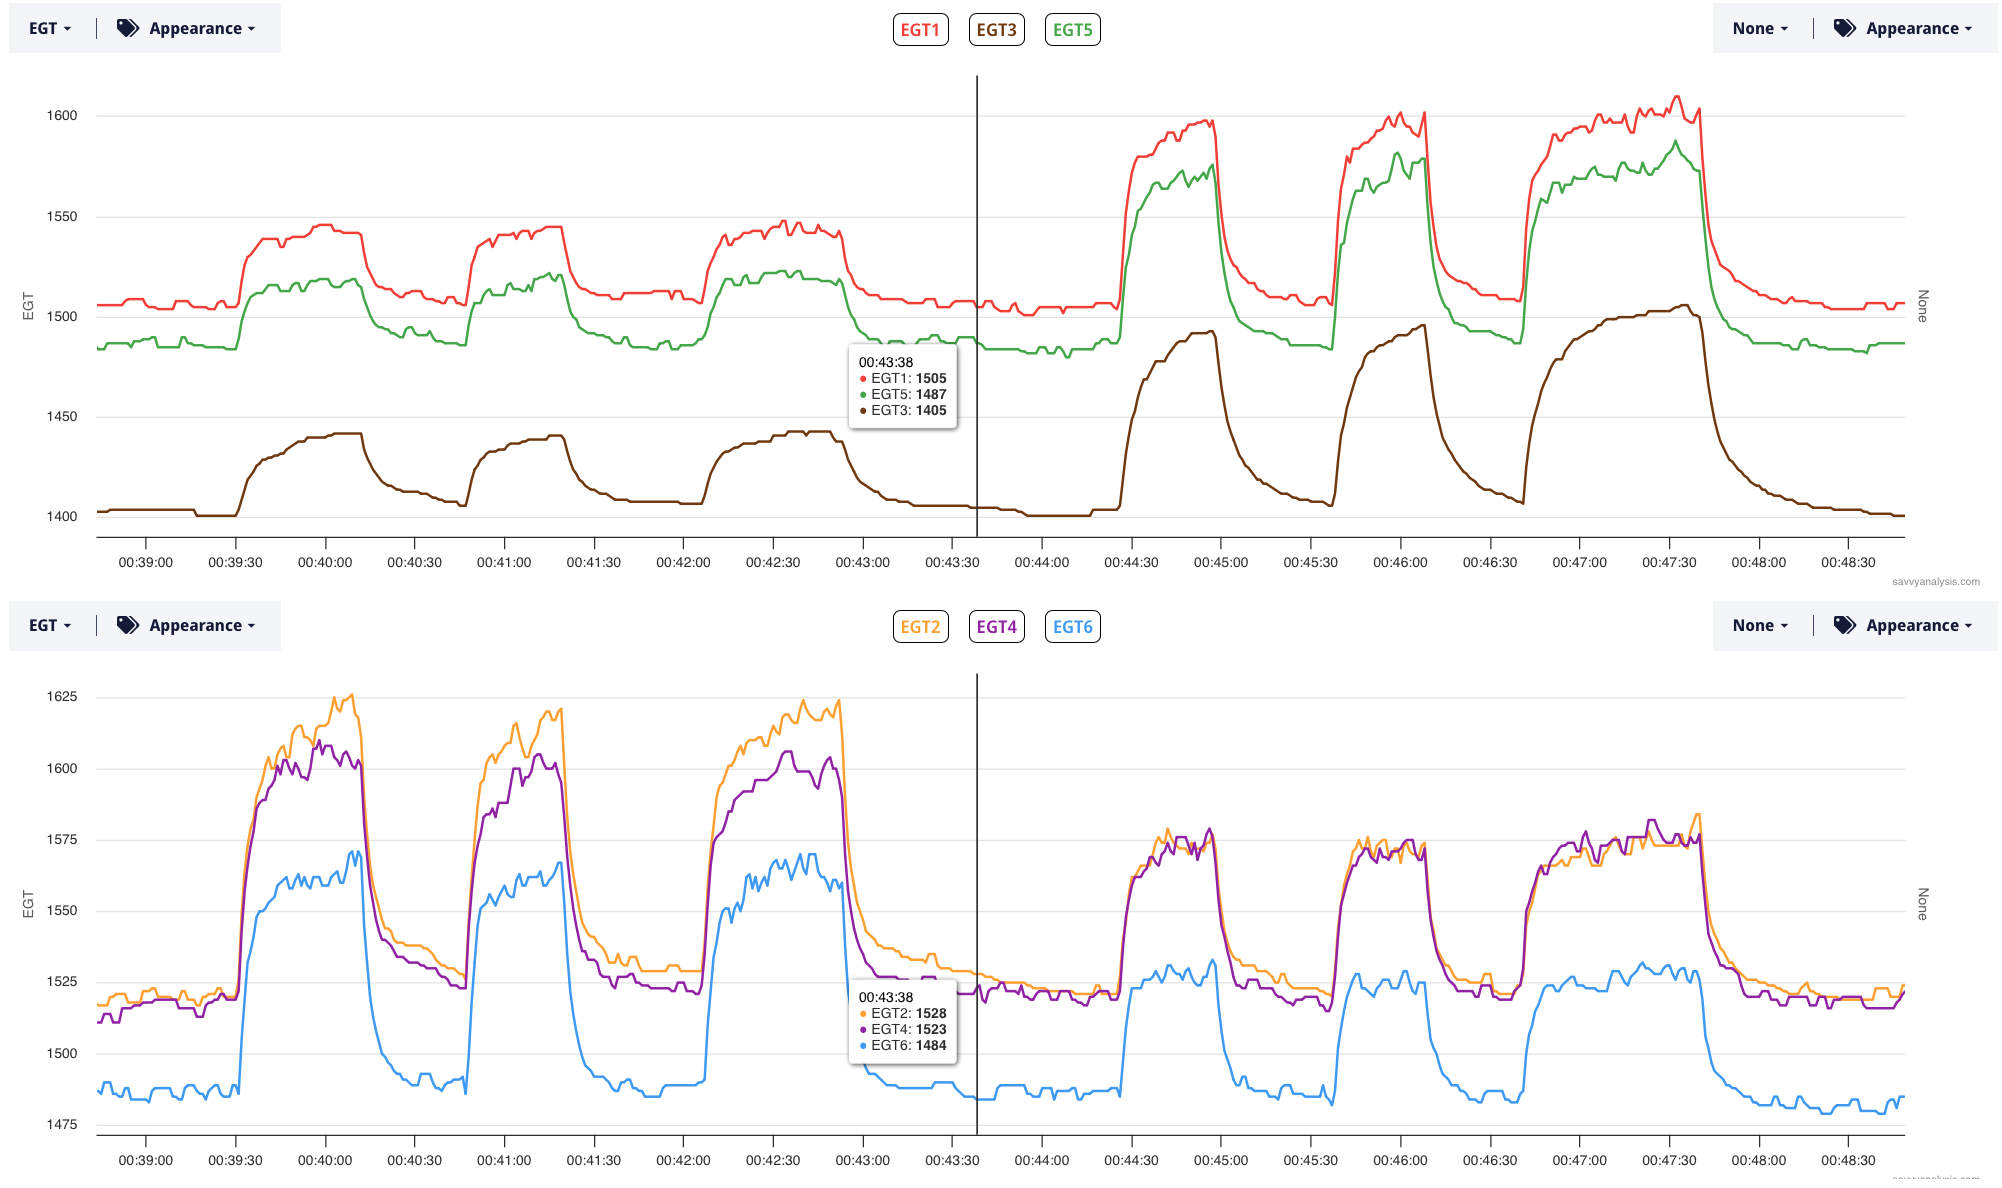
This is a great LOP mag check. It doesn’t follow our guidance, which is L-BOTH-R. This is R-BOTH-R-BOTH-R-BOTH over about a half minute, then L-BOTH-L-BOTH-L-BOTH over about a half minute. The patterns are nearly identical for each isolated mag. The team of analysts can and do evaluate mag checks with only one “hit” on each mag – and that was our guidance in the test profile. But now that we’ve seen this – it’s so much easier to make a reliable evaluation with a series of corroborating EGT rises.
The problem would be if you isolated a mag and had weak spark. You wouldn’t be inclined to give us two more instances. Especially if you follow our recommendations and reduce power before yielding to the temptation of going back to both mags. And we do recommend that power reduction as outlined in the test profile. The chance of doing damage to the exhaust system is just too great to risk it.
We haven’t amended the test profile, but if you want to give us more than one “hit” on each mag we’ll take it.
Next is data from a Cessna TR182 Turbo Skylane powered by a Lycoming 0–540 and data from a JPI 830 with a one second sample rate. This is a four-hour cross-country flight with EGTs on top, and CHTs and FF below.
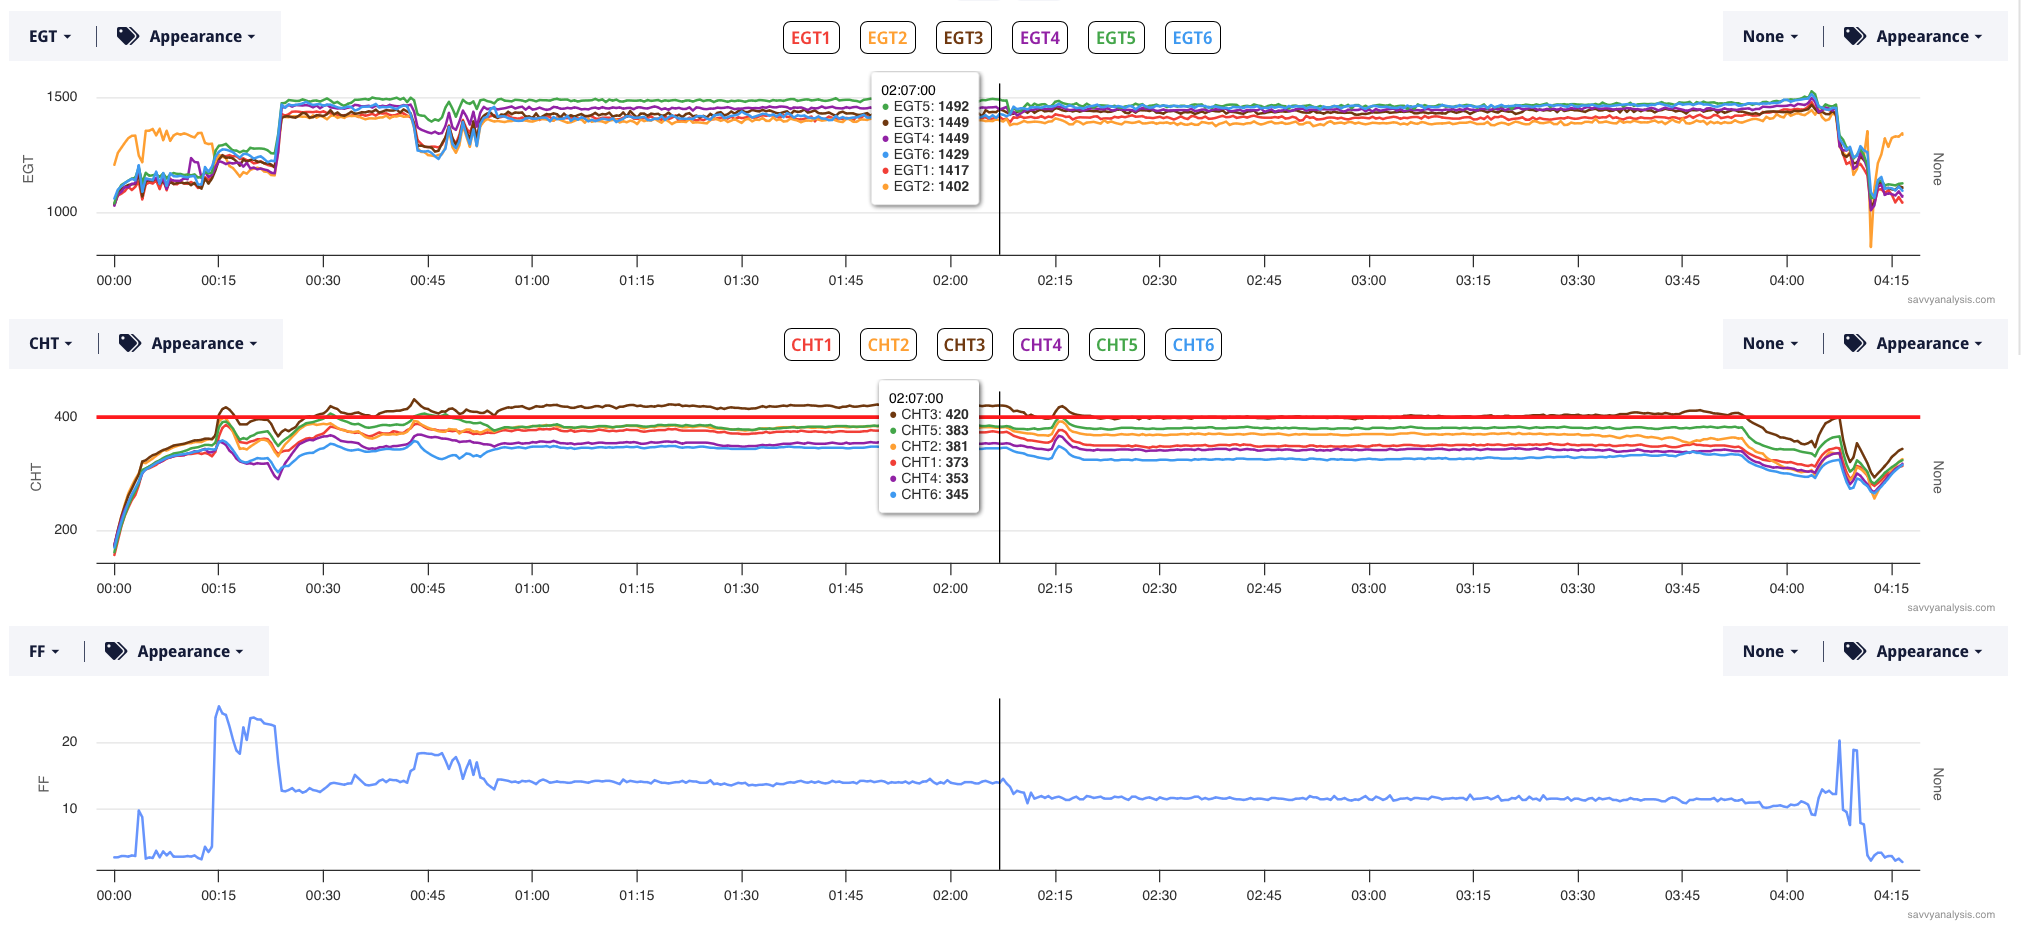
CHT 3 is high for the first half of the flight, then drops below the 400º redline when the pilot runs a little leaner. Notice that after 03:30 there’s a little bit of movement in a couple of the CHT traces. Let’s zoom in and look at CHT’s, altitude and FF. Cursor is at 03:30.
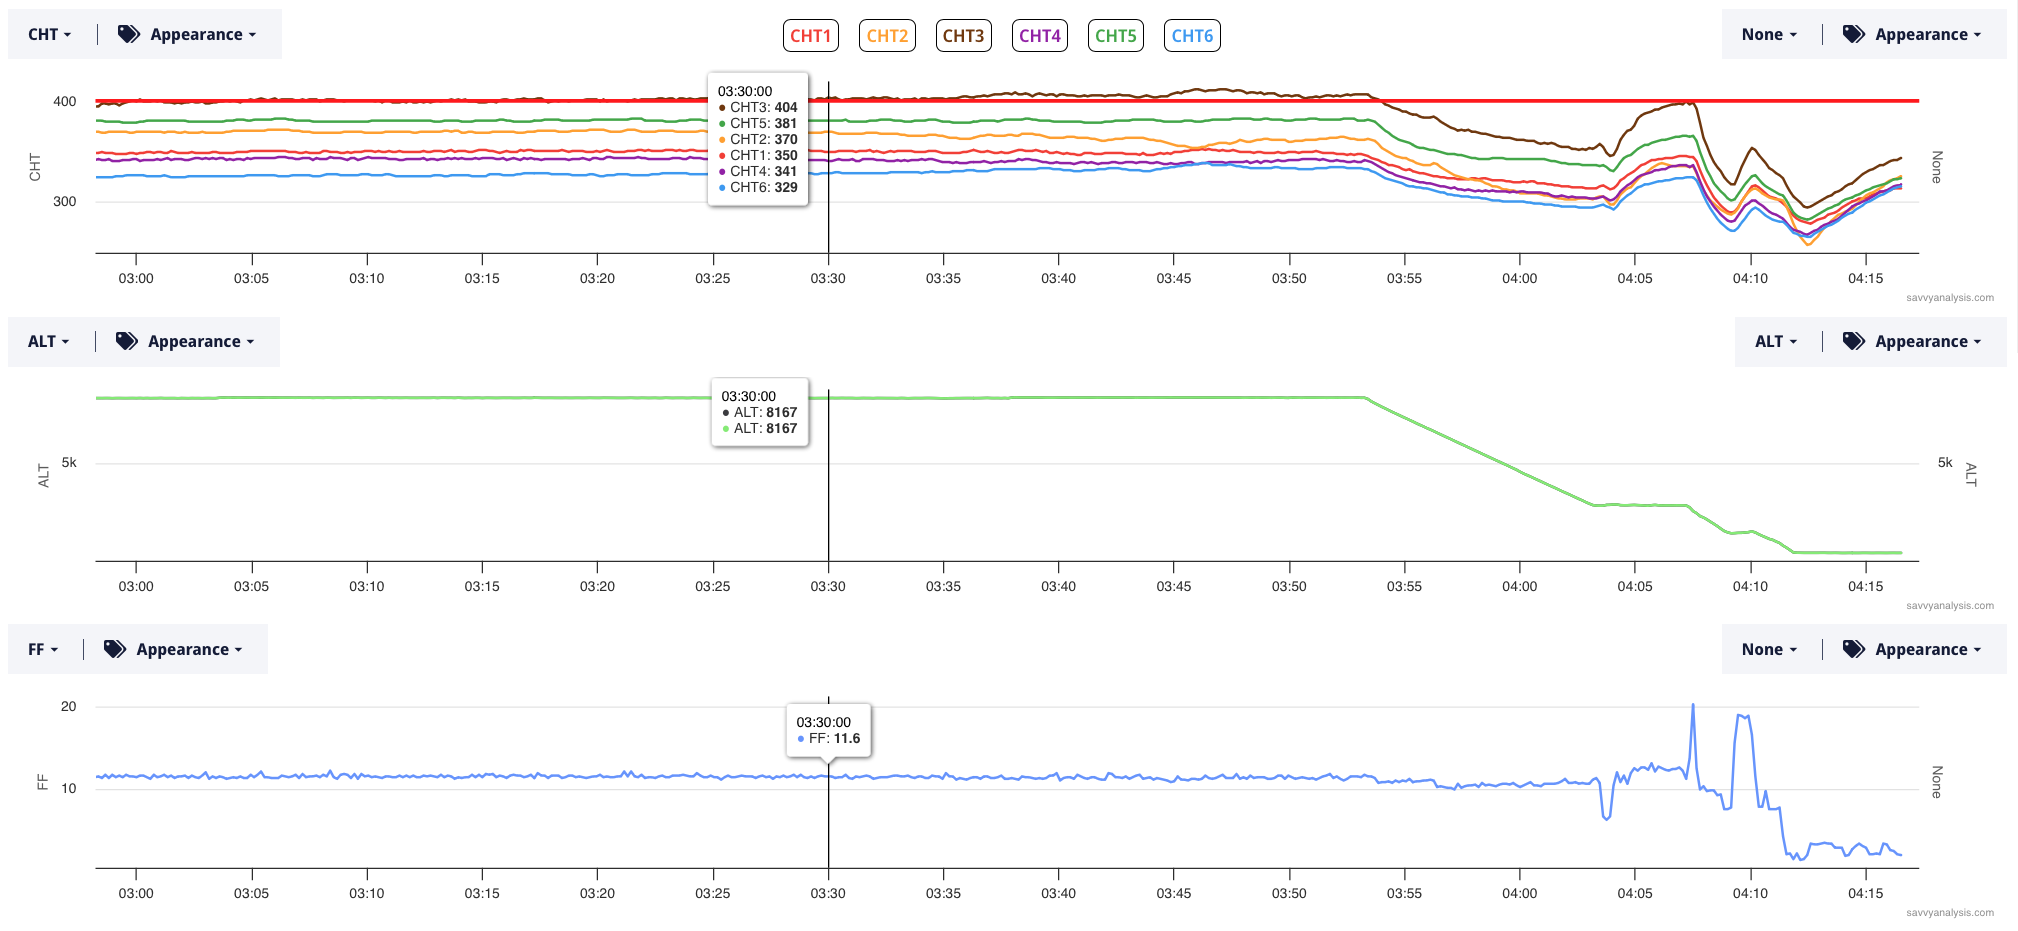
So the movement in CHTs isn’t because of a power change or the beginning of descent – not until 03:55. Let’s look at CHTs, oil pressure and oil temp for this flight segment.
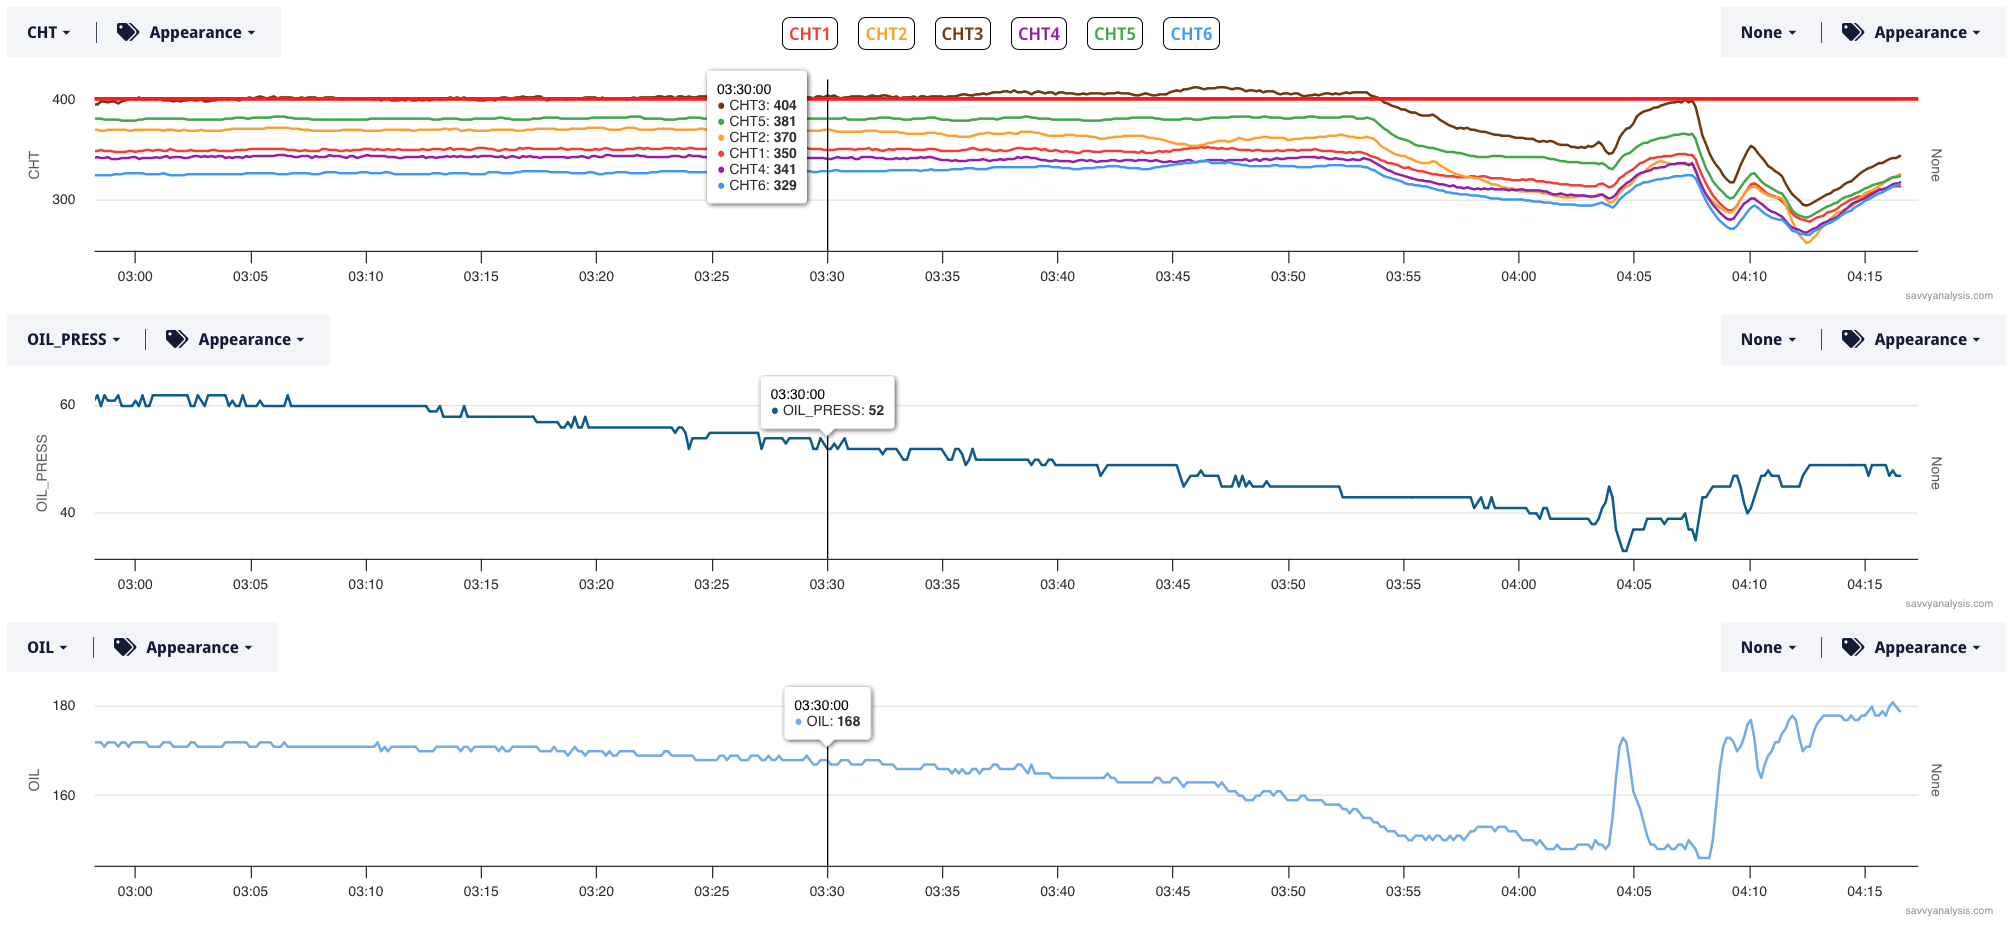
Full disclosure – we knew to look at oil pressure and temp because our client reported “Upon landing noticed lots of oil coming out of cowl flap and running back along belly of plane and along gear. Dip stick has only a tiny bit of oil at the very bottom.” And the dreaded words “Plane just came out of annual.”
The vacuum pump had been replaced during annual, and one of the oil hoses was disconnected to make room for wrenches. When the hose went back on, it wasn’t tightened and torque striped and after about three hours, got loose enough to start leaking. The surprise is that the CHT’s showed only the slightest sign of increased heat and friction as the oil supply went away.
The low hanging fruit of borescope analysis was spotting green spots on exhaust valves. Green spots indicate mid stage or late stage burning and are pretty much the last step before a valve gets munched in service. So we really want to continue to remove those whenever we see one. One of the additional benefits is catching uneven heating patterns because in some cases, those valves can be lapped and remain in service. Every once in a while, we spot the condition that leads to uneven heating – a worn valve guide.
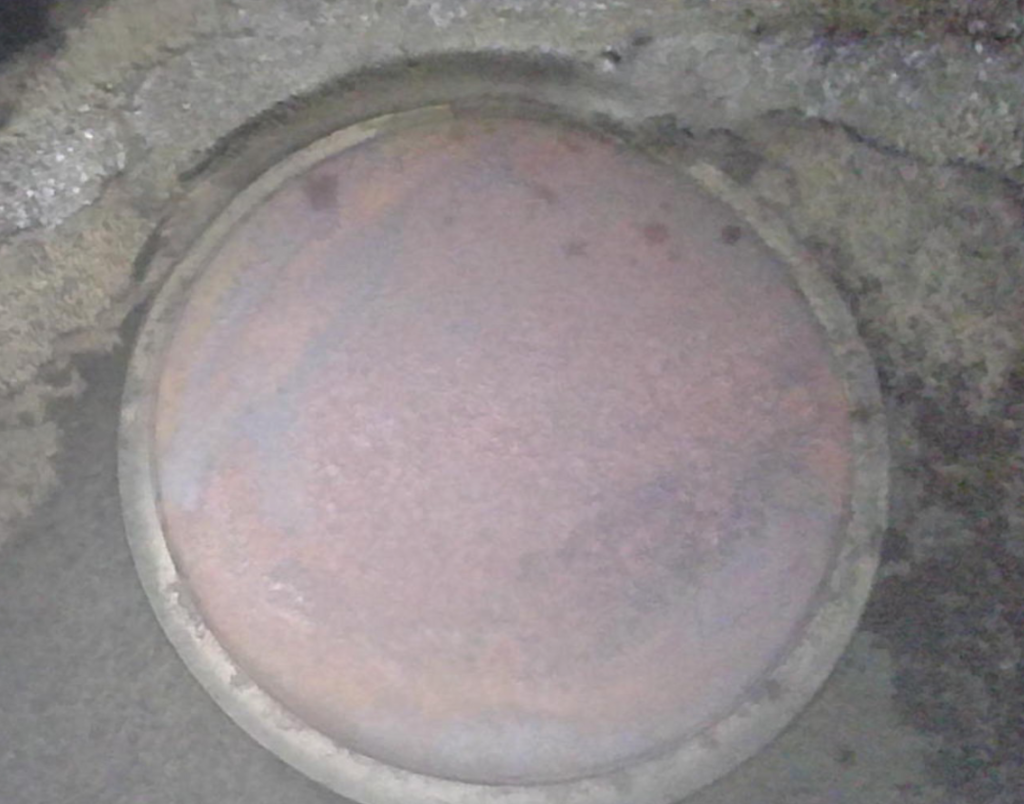
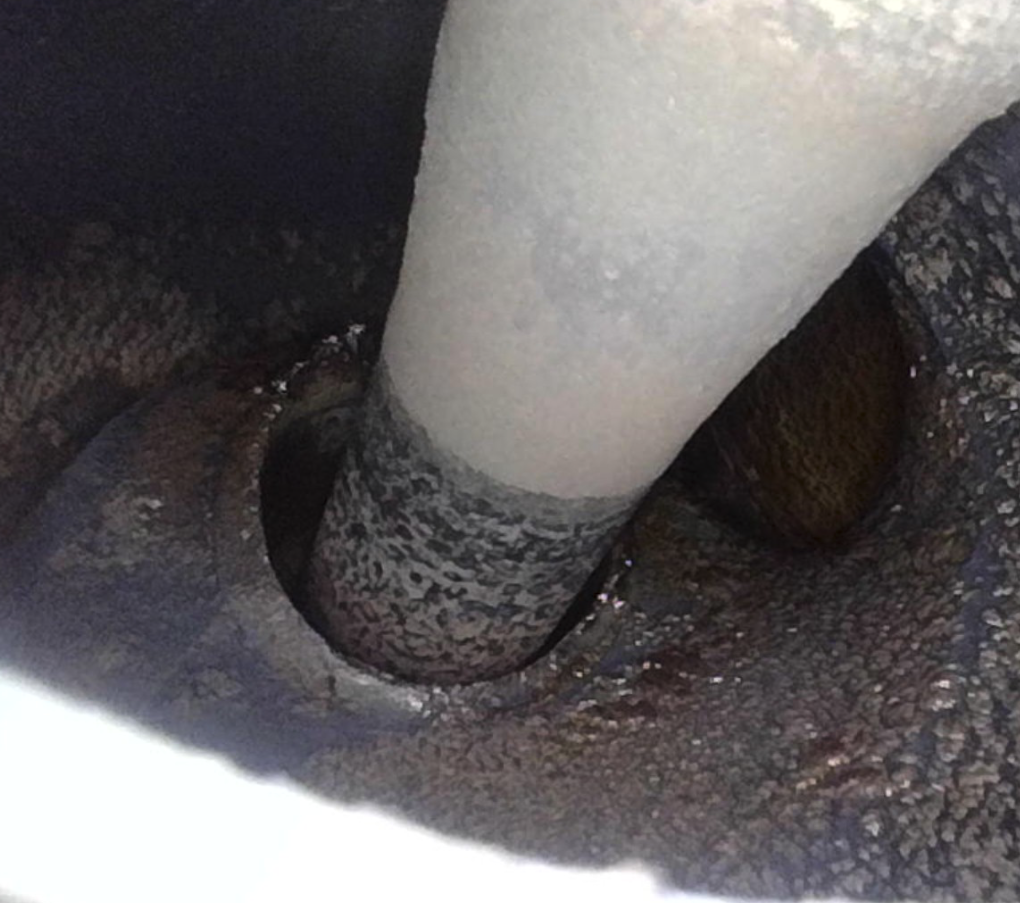
Some clients – and shops – just have a knack for taking good borescope pictures. The shots are framed right and the lighting is appropriate. Valve stem pictures can be tough because of how dark it is behind the valve head. These are good shots.
If you’re struggling – and you’ll know because your report will flag some of your pictures as unusable – we’d recommend reviewing Savvy’s Borescope Inspection Checklist for guidance on what we’re looking for in each picture.
We’ll finish this month with an Extra 400 powered by a Continental TSIO–550 and data from an EI CGR – 30P with a one second sample rate. Something is hinky about this data. The parser says it’s a 2:39 flight and this segment is about a third of it so that jibes. But when we look at the whole flight it’s showing almost 8 hours in the air. I have some theories about a flight parallel to and sometimes crossing a US timezone boundary- but let’s not bog down with the hinky timeline. Let’s stick with the engine data.
The Puzzler element is – based on what you see below would you continue the flight?
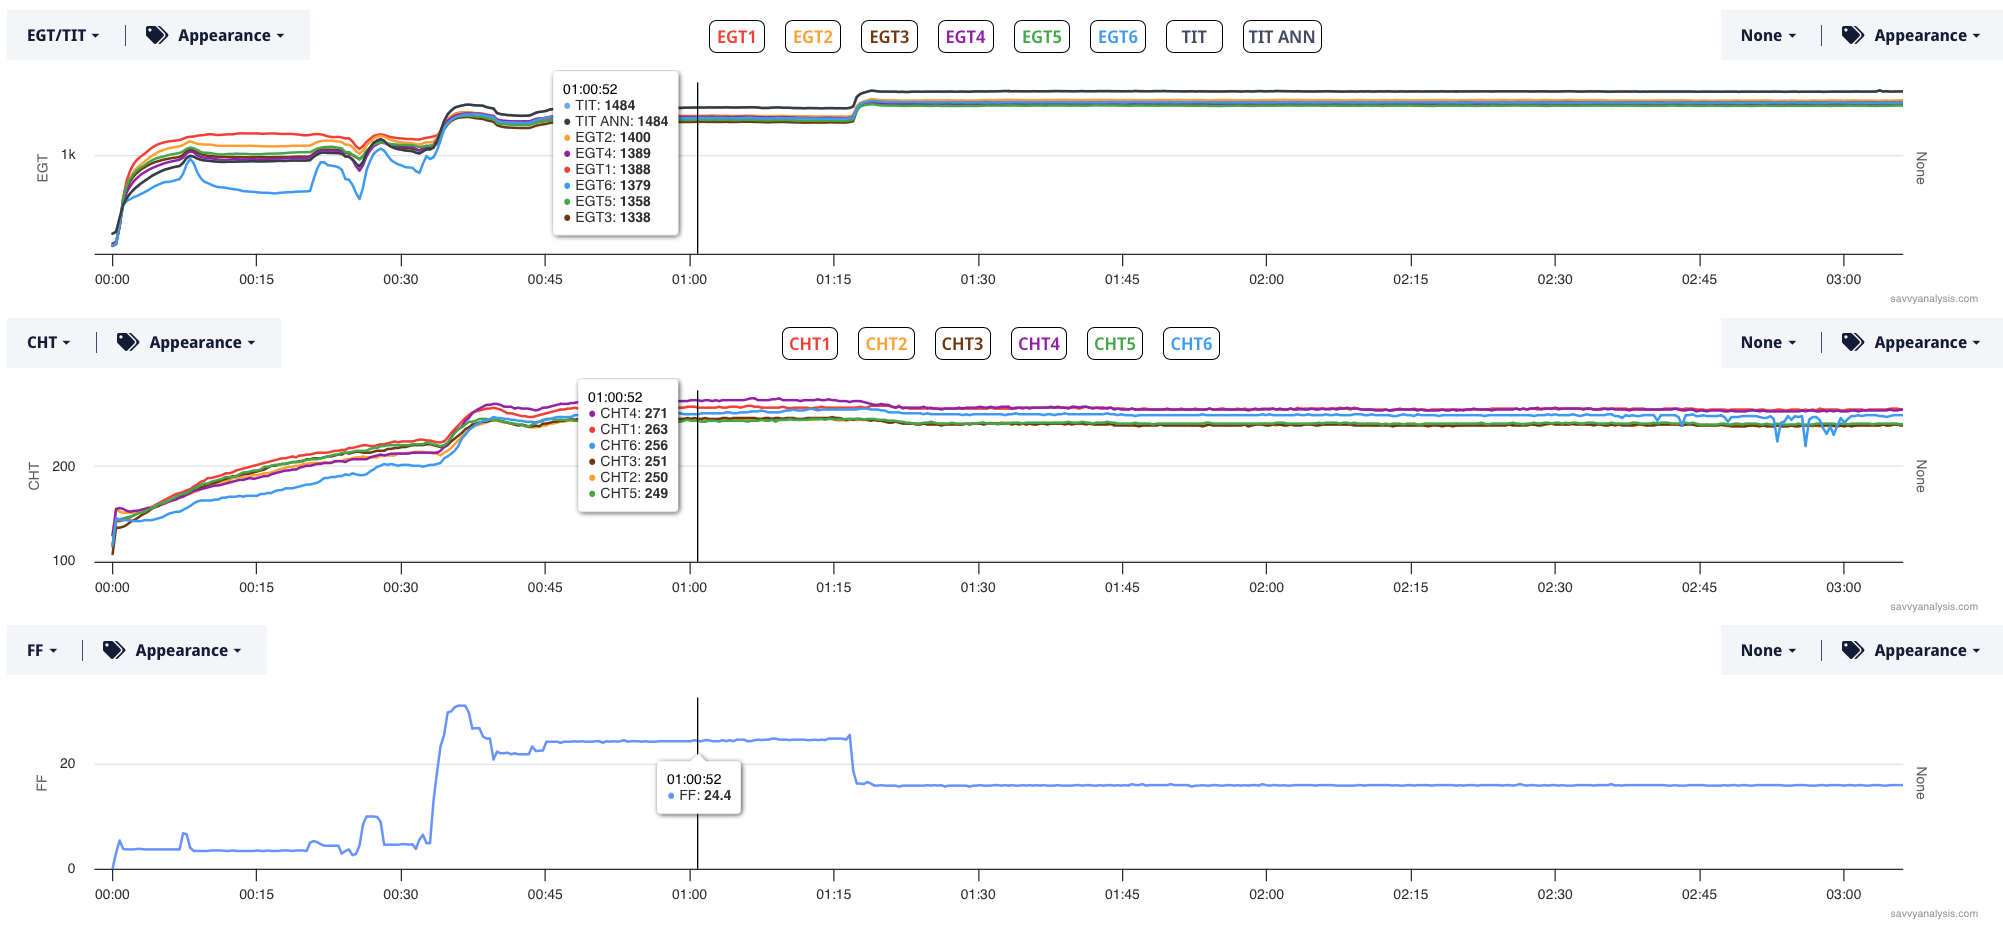
EGT and CHT 6 were a little low during taxi-out but ok after that – until CHT 6 started acting up around 02:40. Everything else looks rock solid stable. Now let’s look at what happens next. Here’s the whole flight.
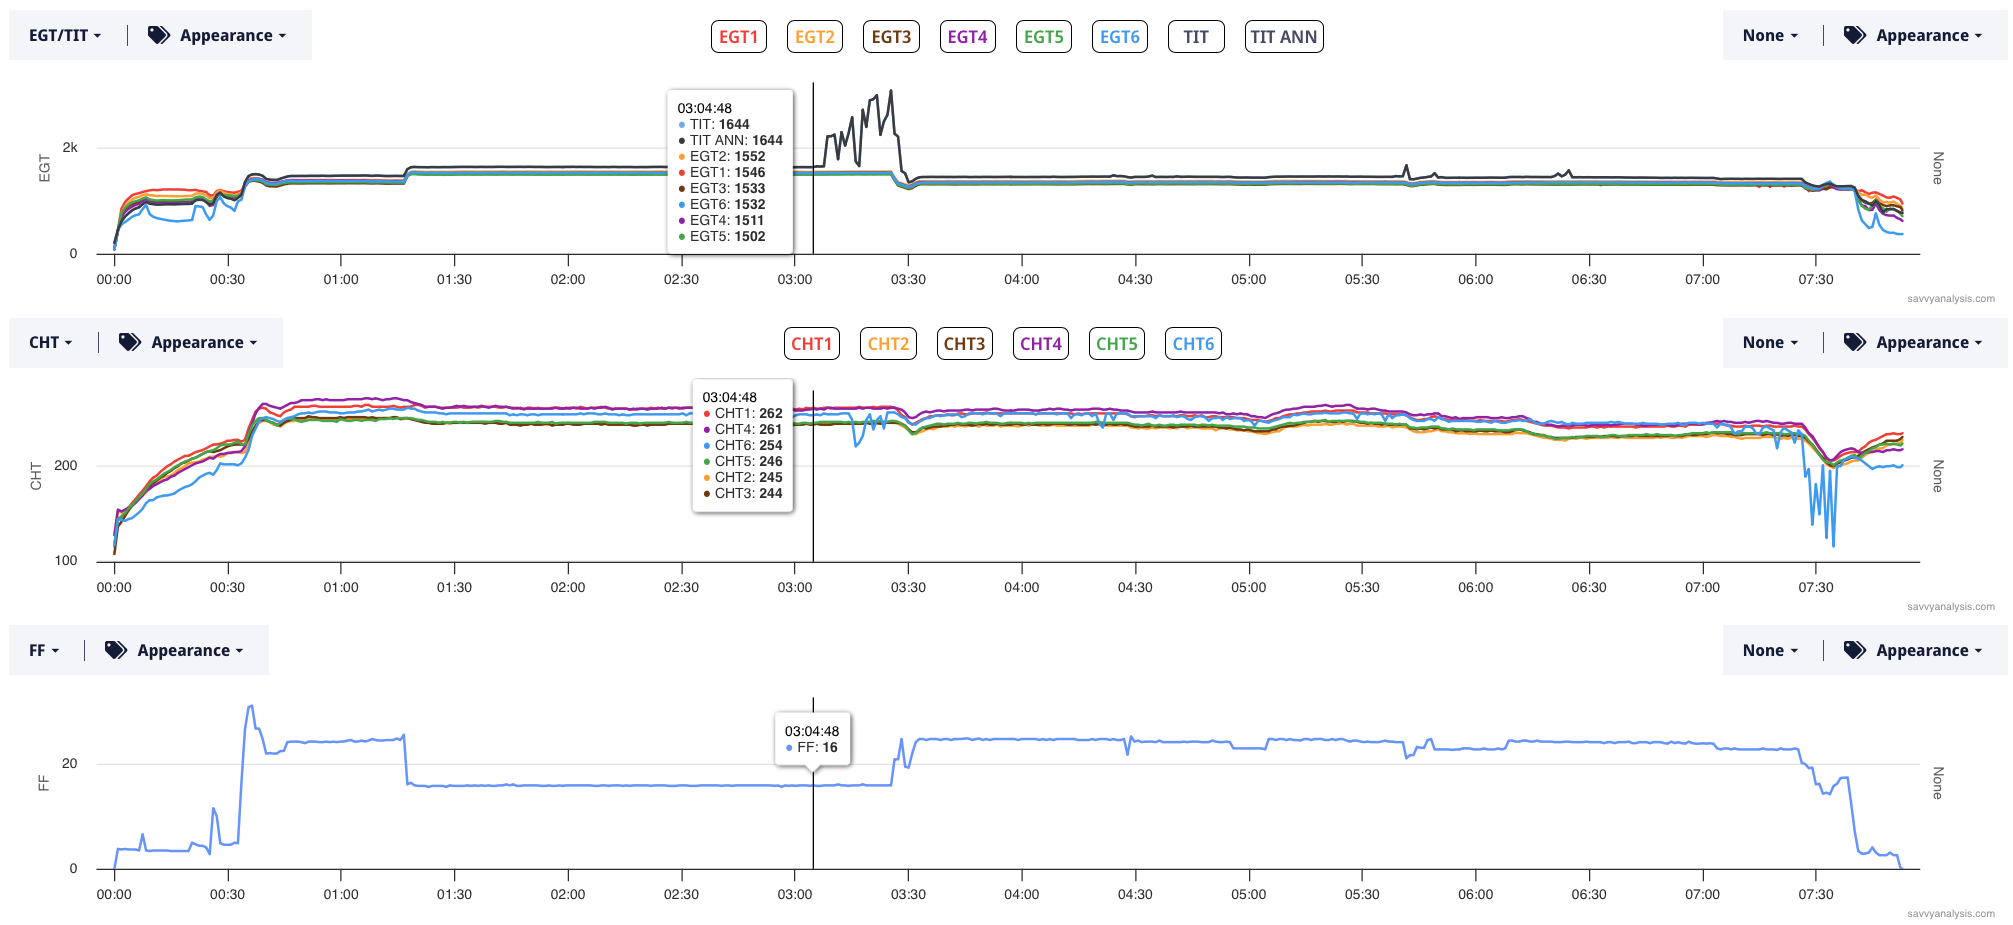
TIT makes a series of 6 jumps – each higher than the previous one – ending with a peak of 3100º. Not 3101 or 310-anything. Exactly 3100º. It would be nice to say that this is clearly a TIT sensor malfunction because no other data is moving, but CHT6 ruins the plan. But CHT6 was dancing around while the TIT was still rock solid. And it continues dancing around even after the TIT completes its excursion.
It would also be nice to know exactly how long this TIT excursion lasted, but remember we have that discrepancy for the length of the flight. If I had to choose a side, I would go with 02:39 versus the nearly 8 hours depicted here.
So now the Puzzler question is having seen this TIT excursion in real time, are you comfortable ignoring it and continuing on to your destination as this pilot did? Reviewing the flight data before this flight, we could see lots of examples of CHT six dancing around like this. So maybe the pilot knew that CHT6 was not to be trusted and although the TIT that looked pretty scary there for a while, the engine was smooth as silk, and all the other data indicated nothing amiss.