I’m in the middle of Walter Isaacson’s new book on Nobel Prize winner Jennifer Doudna. She co-founded CRISPR which is an acronym for clustered regularly interspaced short palindromic repeats. Imagine having the tools to make humans immune to viruses or other diseases. We could eliminate baldness. And glasses. And hearing aids. And maybe cancer. All sorts of ethical questions arise when we talk about genetic engineering to remove human “flaws”. But it would be nice to have it for airplanes.
Maybe we do – sort of. Certified airplanes “technically” leave the factory per the FAA-approved Type Certificate Data Sheet and with zero flaws in the airframe and powerplant. “Technically” because there are Mondays and Fridays and no guarantees that everything was assembled to perfection. With experimental airplanes often the goal of the first few flights is to uncover the flaws. Even if we were to achieve perfection at zero hour, it’s what happens to airplanes in service that causes most of the trouble. So while we dream about the perfect world, fortunately we have tools to help us cope with the real one.
First up this month is Cirrus SR 20 with a Continental IO-360 and data from a Garmin Perspective with a 1 sec sample rate. This is my standard first-glance layout of EGT, CHT, FF and oil temp. Nothing special about the cursor placement.
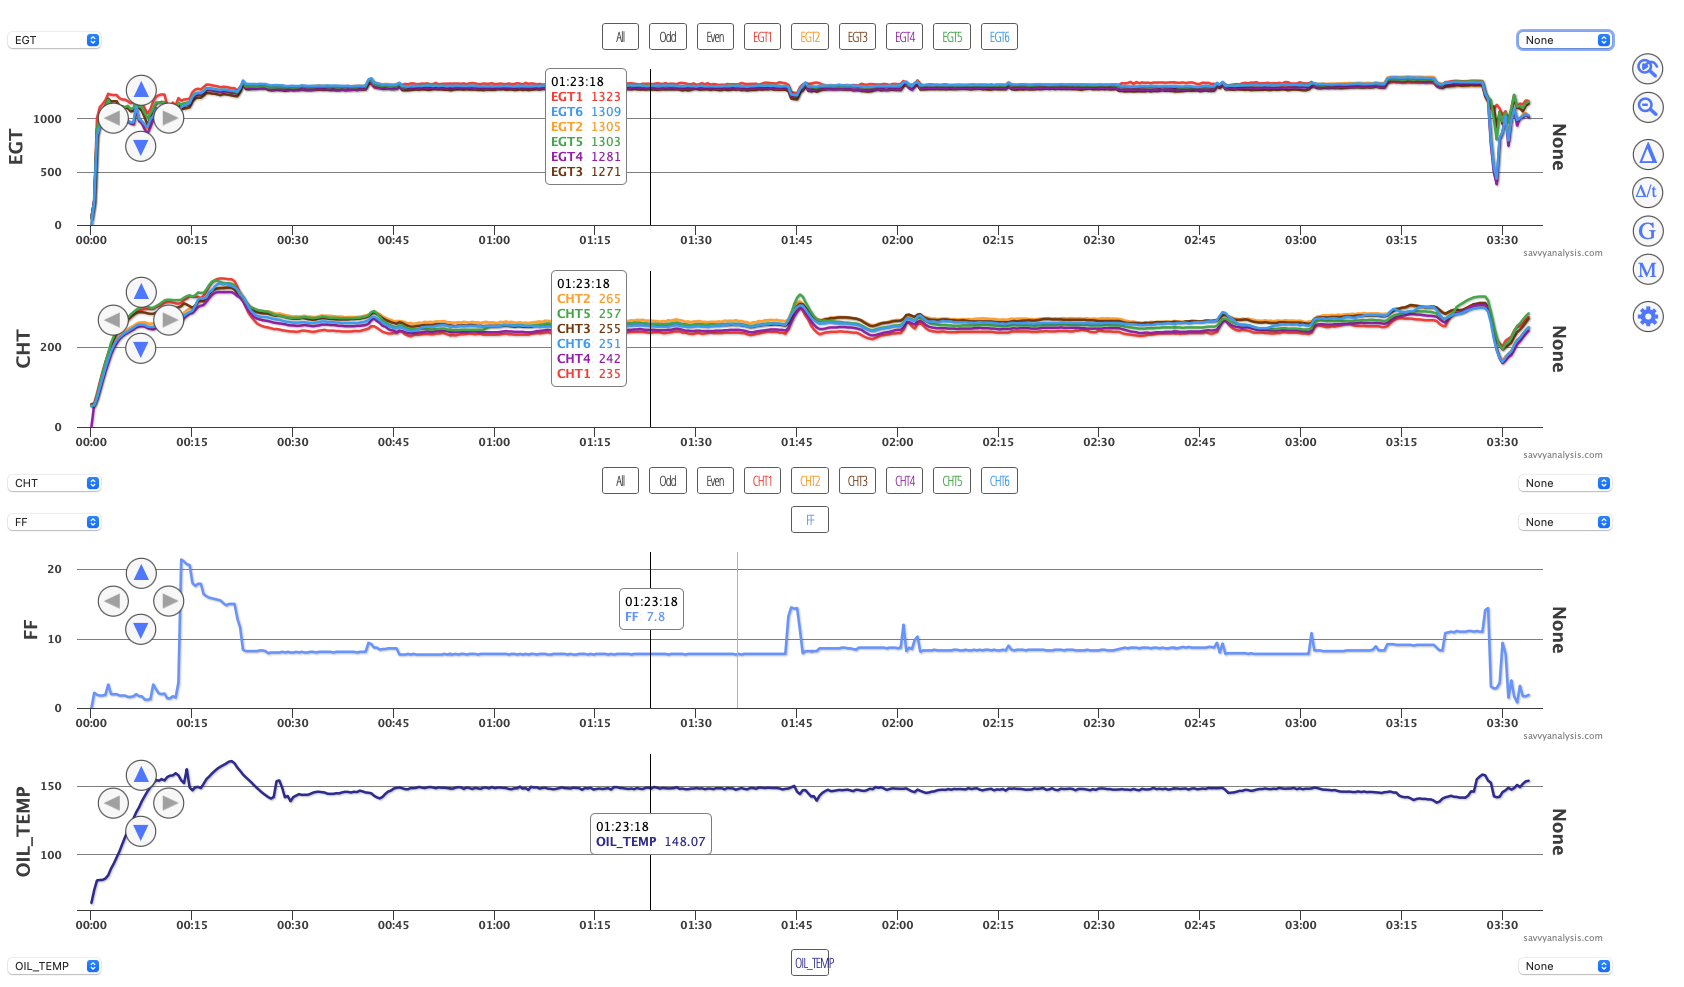
Looks like a nice uneventful 03:30 minute flight. The ticket subject was “erratic MAP” so here’s the same flight displaying MAP, RPMs and % power.
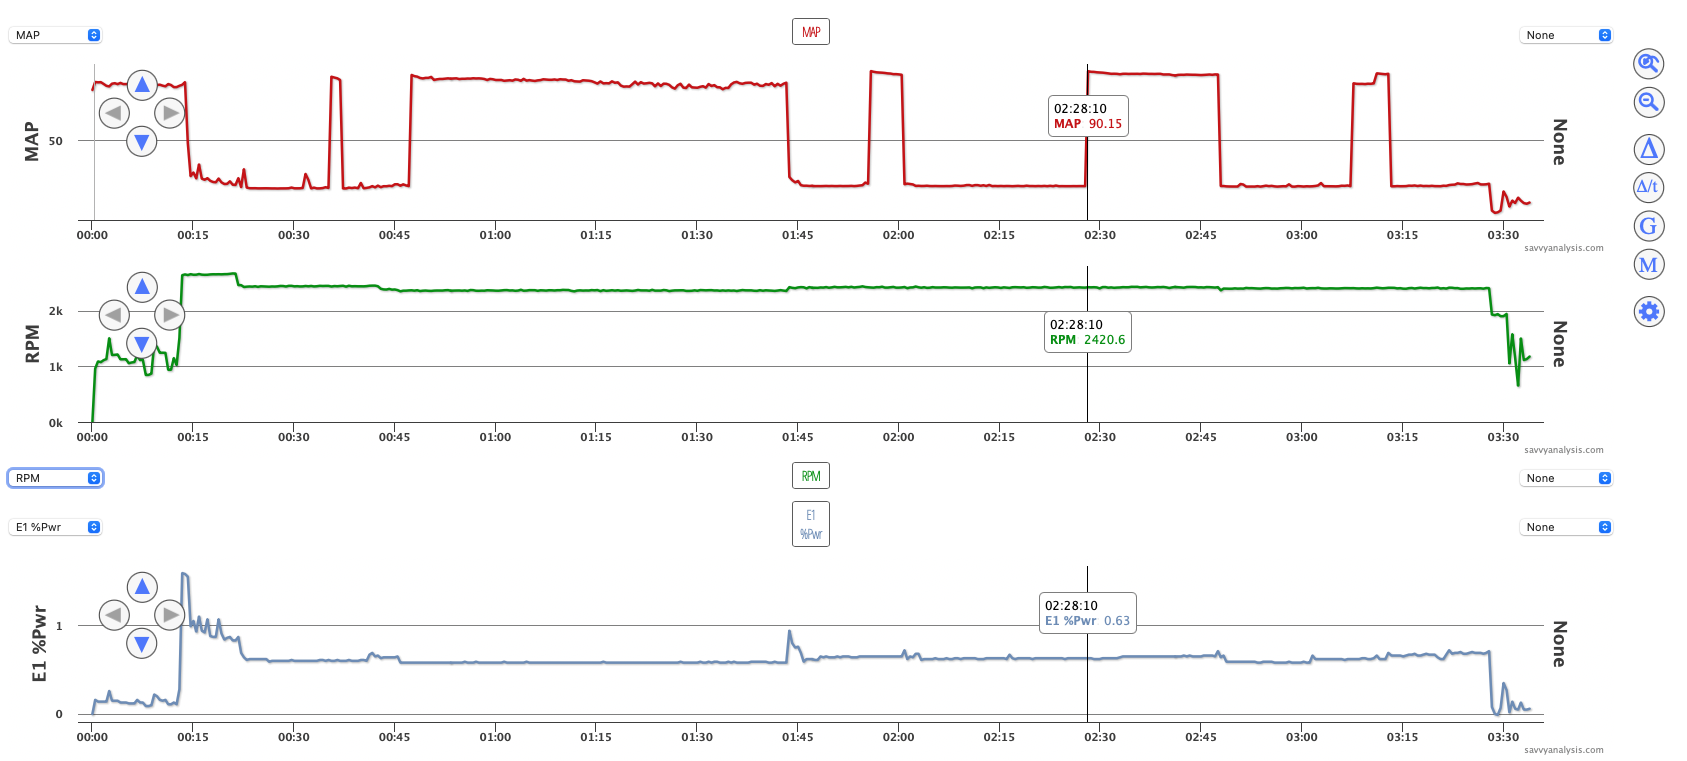
Yep, that’s a 90.15″ reading on the MAP – one of several in that range – which is enough to make a P-51 jealous. It was about 80″ at engine start. We know it’s bogus because it’s not a turbo, the % power never changes, EGTs and CHTs don’t change, ditto oil temp and on and on. The puzzler on this one is whether it’s a sensor failure or a connection issue. Typically with a loose connection you jump to zero or oscillate between the true value and zero. Here it oscillates between the true value and an impossible one. It always makes sense to check the connection first, but in this case it looks like the sensor is failing. But it was considerate of the sensor to announce its failure in such an indisputable way. Imagine if the oscillation was from actual MAP to an increase or decrease of a half-inch or some other plausible number.
Next up is data from a Piper Aztec with Lycoming IO-540 engines and data from an Insight G4 with a 1 sec sample rate. With twins the default four-rank layout is EGT and CHT for each engine.
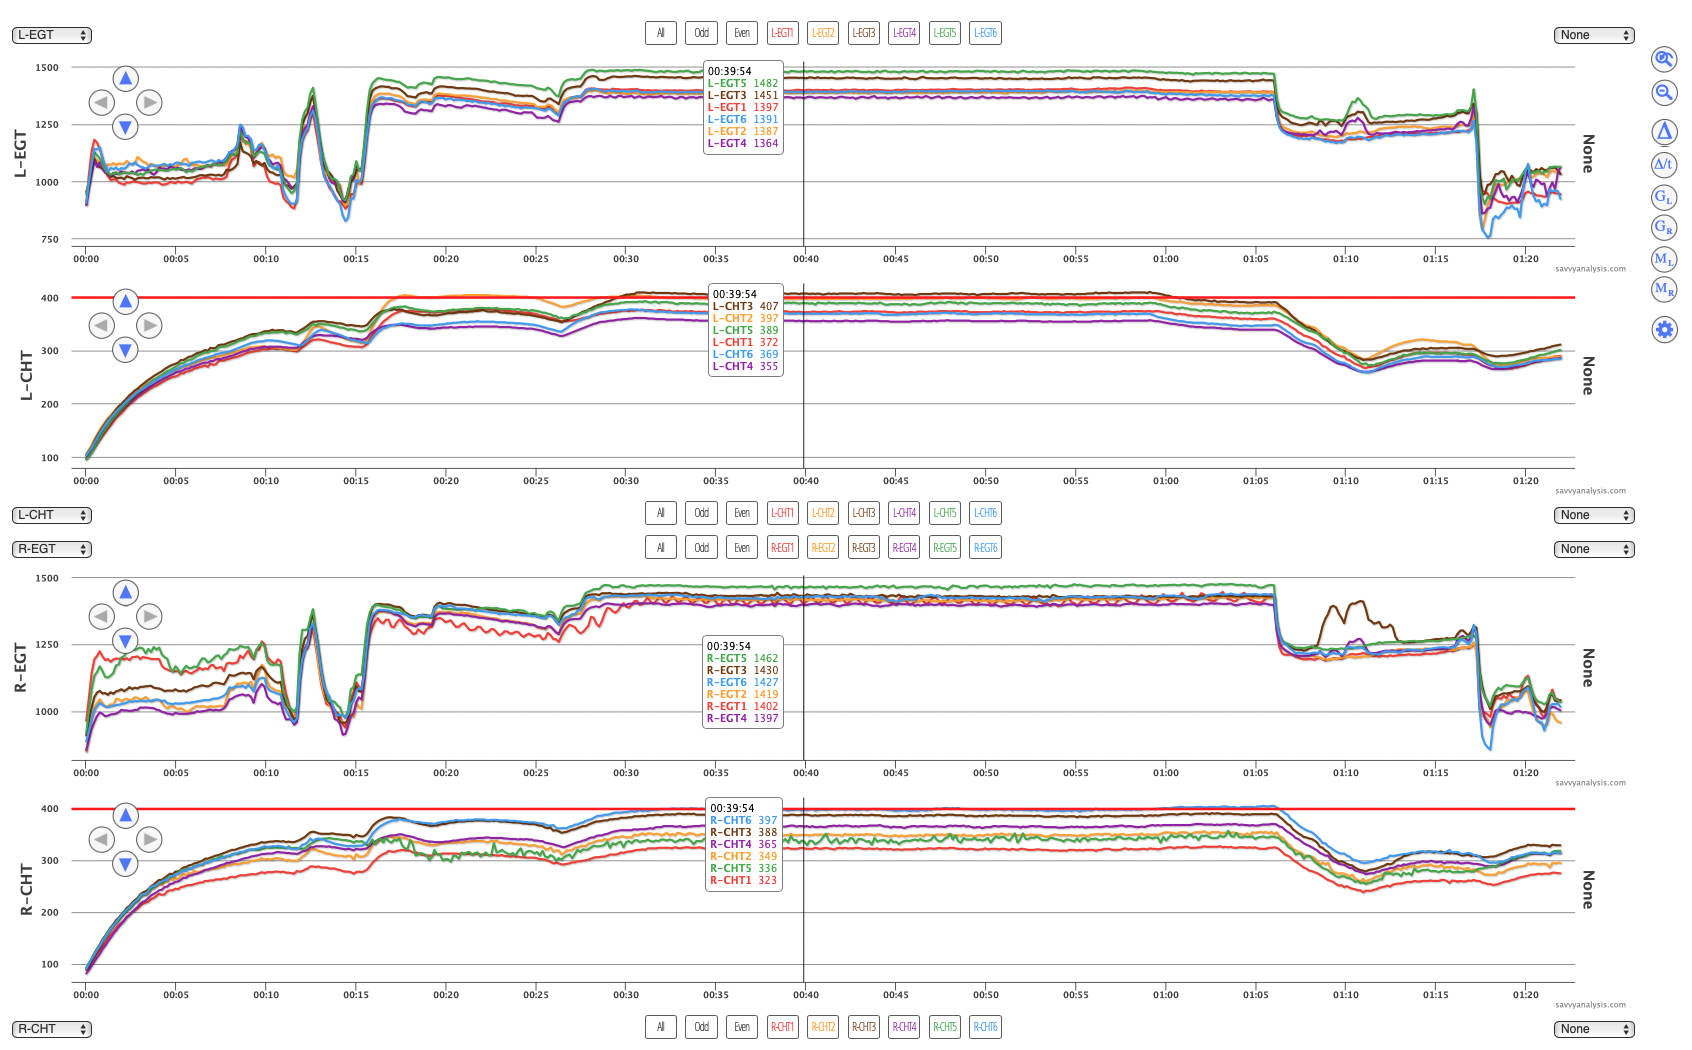
Starting with the L engine, at first glance there’s a slight oscillation in EGT 4, and CHT 4 is low. That wavy pattern could be a burned valve resulting in lower power output. Something to keep an eye on. Also, EGT 5 is high and CHT 5 is in the middle. If it’s weak spark, a LOP mag check should help spot it. And CHT 2 is high in initial climb, but since EGT 2 is not high there it looks like a cooling issue that improves once the nose is pushed over for cruise.
Moving to the R engine, EGTs 1 and 5 are high during idle. 3 is next but not as high. Then at takeoff a wavy pattern develops in EGT 1 and stays there until descent and approach. CHT 1 was low during idle and stayed there throughout the flight. Thinking back to the purple traces of L engine cyl 4, these red traces of R engine cyl 1 are probably what they would look like in another 20ish hours. R engine cyl 1 looks like a burning valve resulting in lower power output. Here are R engine EGTs zoomed into the cruise segment and the ∆ tool calculating the change in EGT during one cycle of the wave. Cyls 2 through 5 are 1-3º but cyl 1 is 28º there.
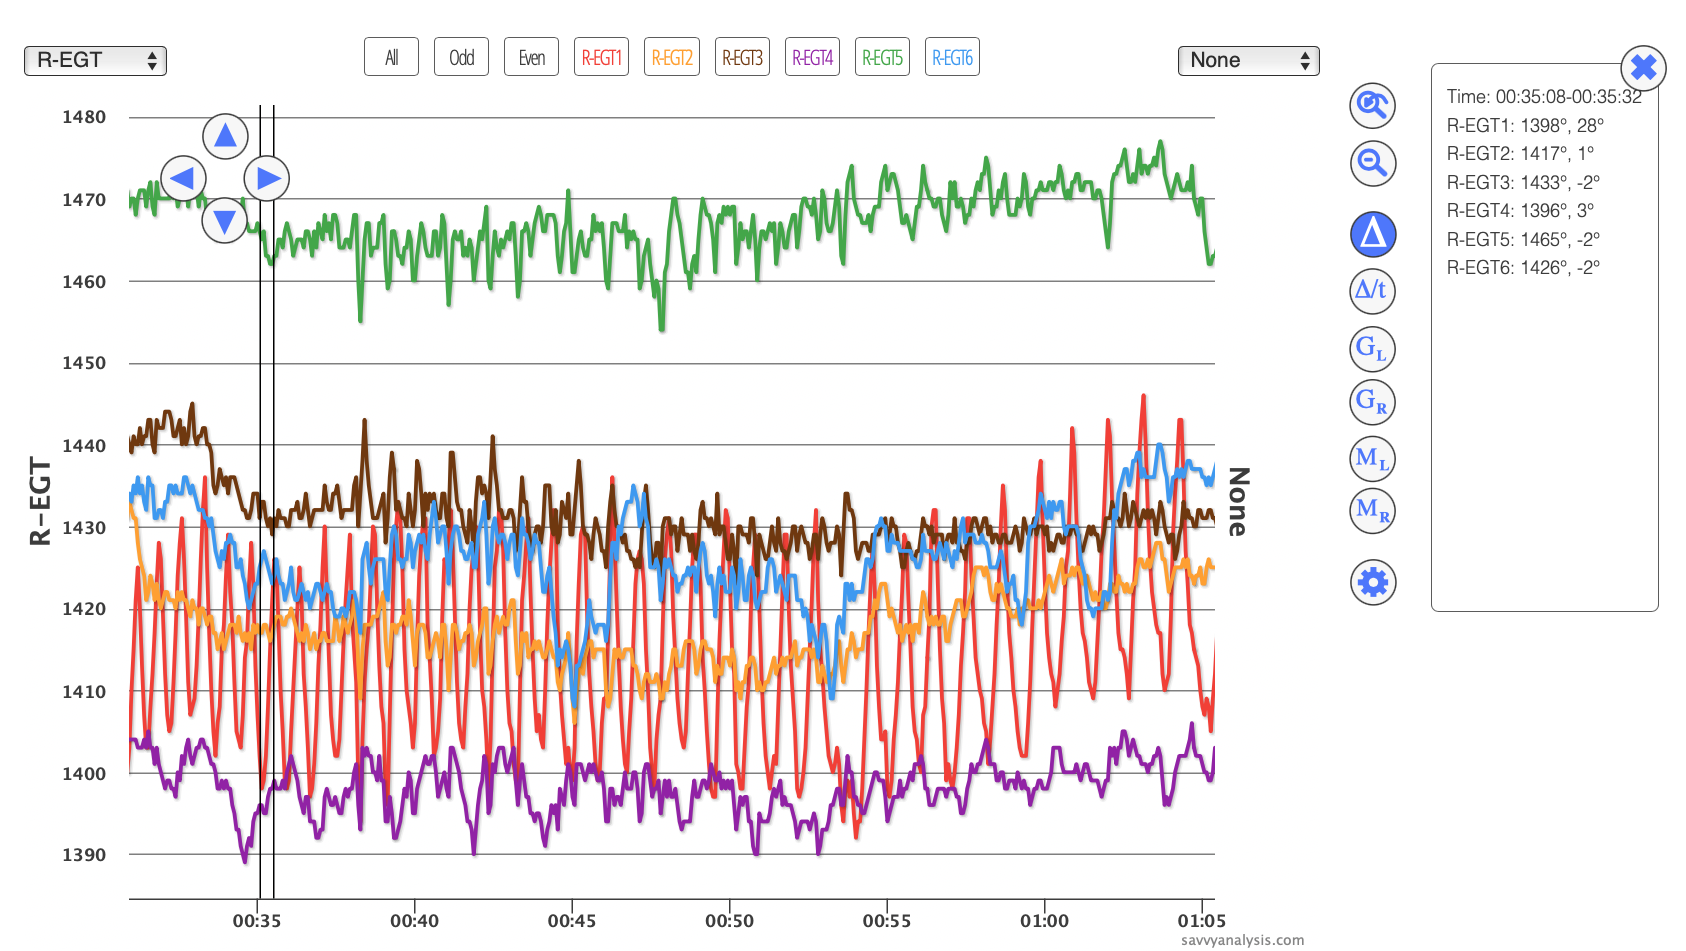
That’s a pretty mature burned valve. When we see this we look for confirmation in previous and subsequent (if there are any) flights and once we’re convinced it’s legit our recommendation would be to borescope the cylinder before further flight.
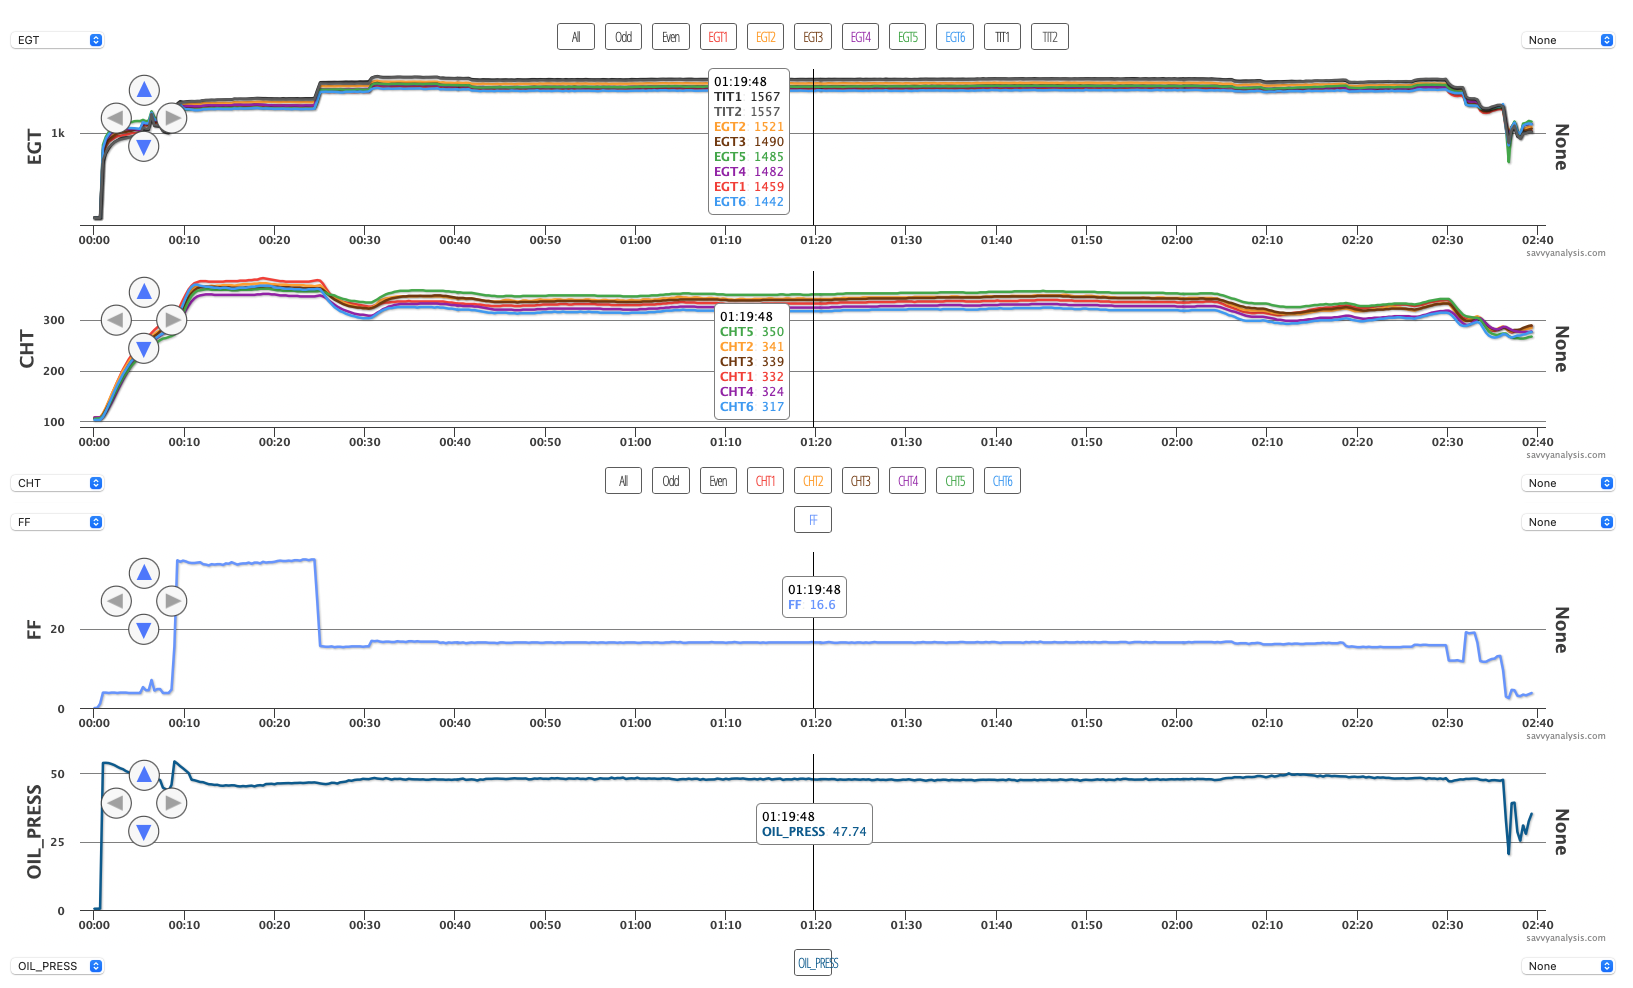
Next up is a Cirrus SR22T with a Continental TSIO-550 and data from a Garmin Perspective with a 1 sec sample rate. This is a typical cruise flight with EGT, CHT, FF and oil pressure instead of oil temp.
Then the airplane went into the shop for a 50 hour inspection. After the inspection the shop performed a ground-run. Here’s the data for that.
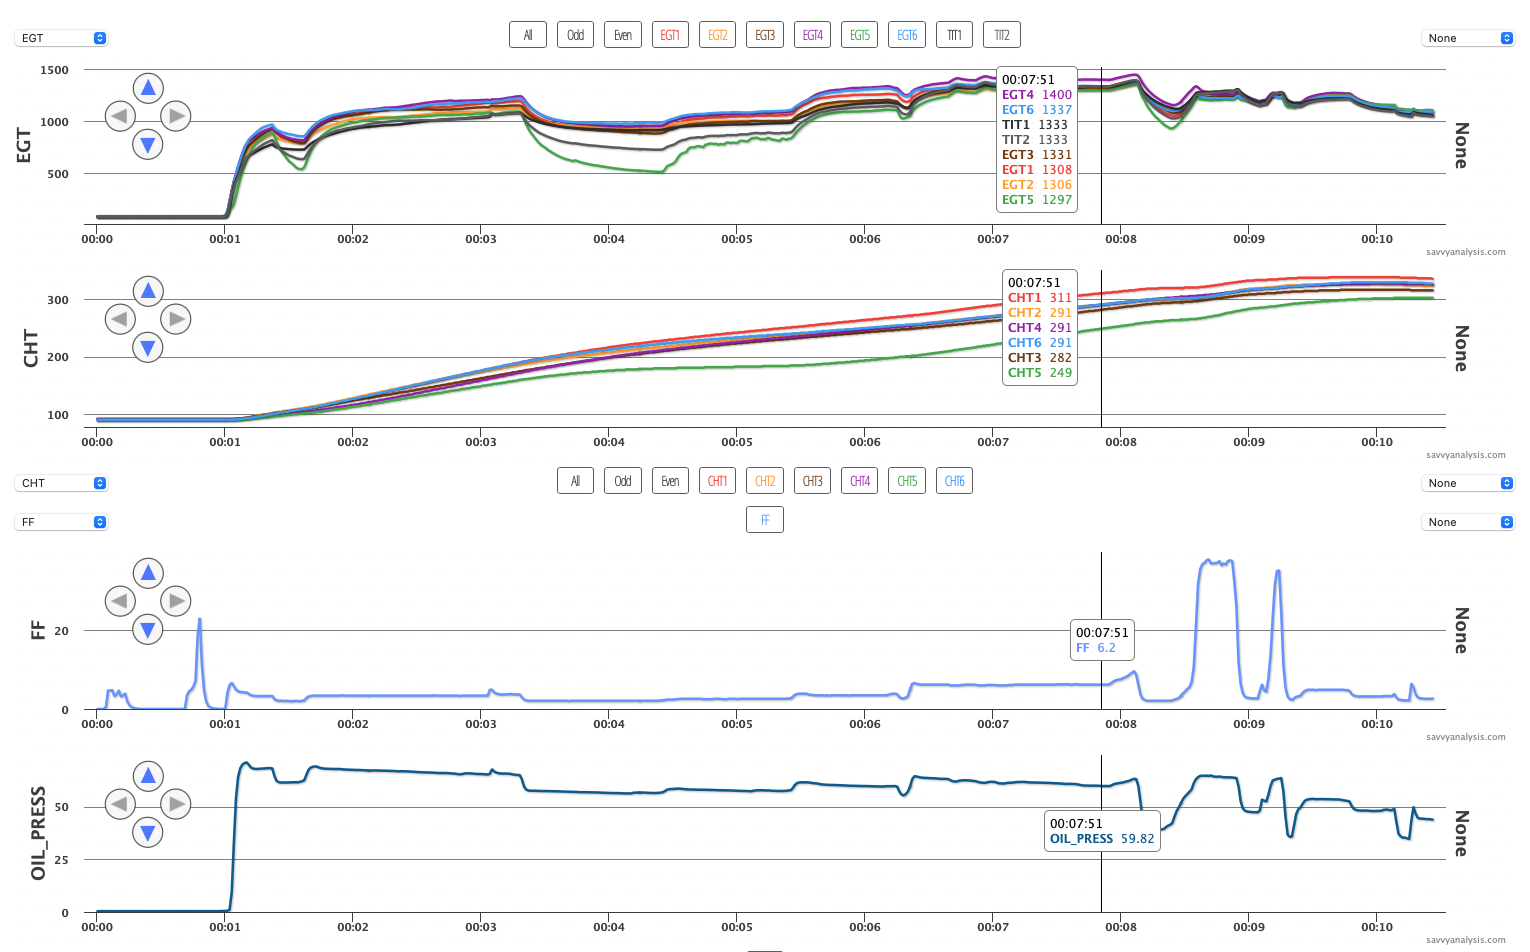
Oil pressure started at 71 psi and gradually dropped to about 60 at the cursor, into the 40s at idle, and around 65 during the two power applications. EGTs and CHTs don’t really offer clues. EGTs 3 and 5 are a little low for a while. CHT 5 is lower throughout. Can those be connected to high oil pressure?
The shop investigated and discovered that they reverse-mounted an oil check-valve that supplies the turbines with oil. Cleaning that valve is part of the inspection checklist. The shop reinstalled the valve, performed a ground run and returned the airplane to the owner. On his next flight, takeoff oil pressure was around 42 and MAP was about 35″ vs the target of 36.5″. Not quite cancel-the-flight low, but not normal either. At idle the oil pressure dropped to the low teens. Here’s that data.
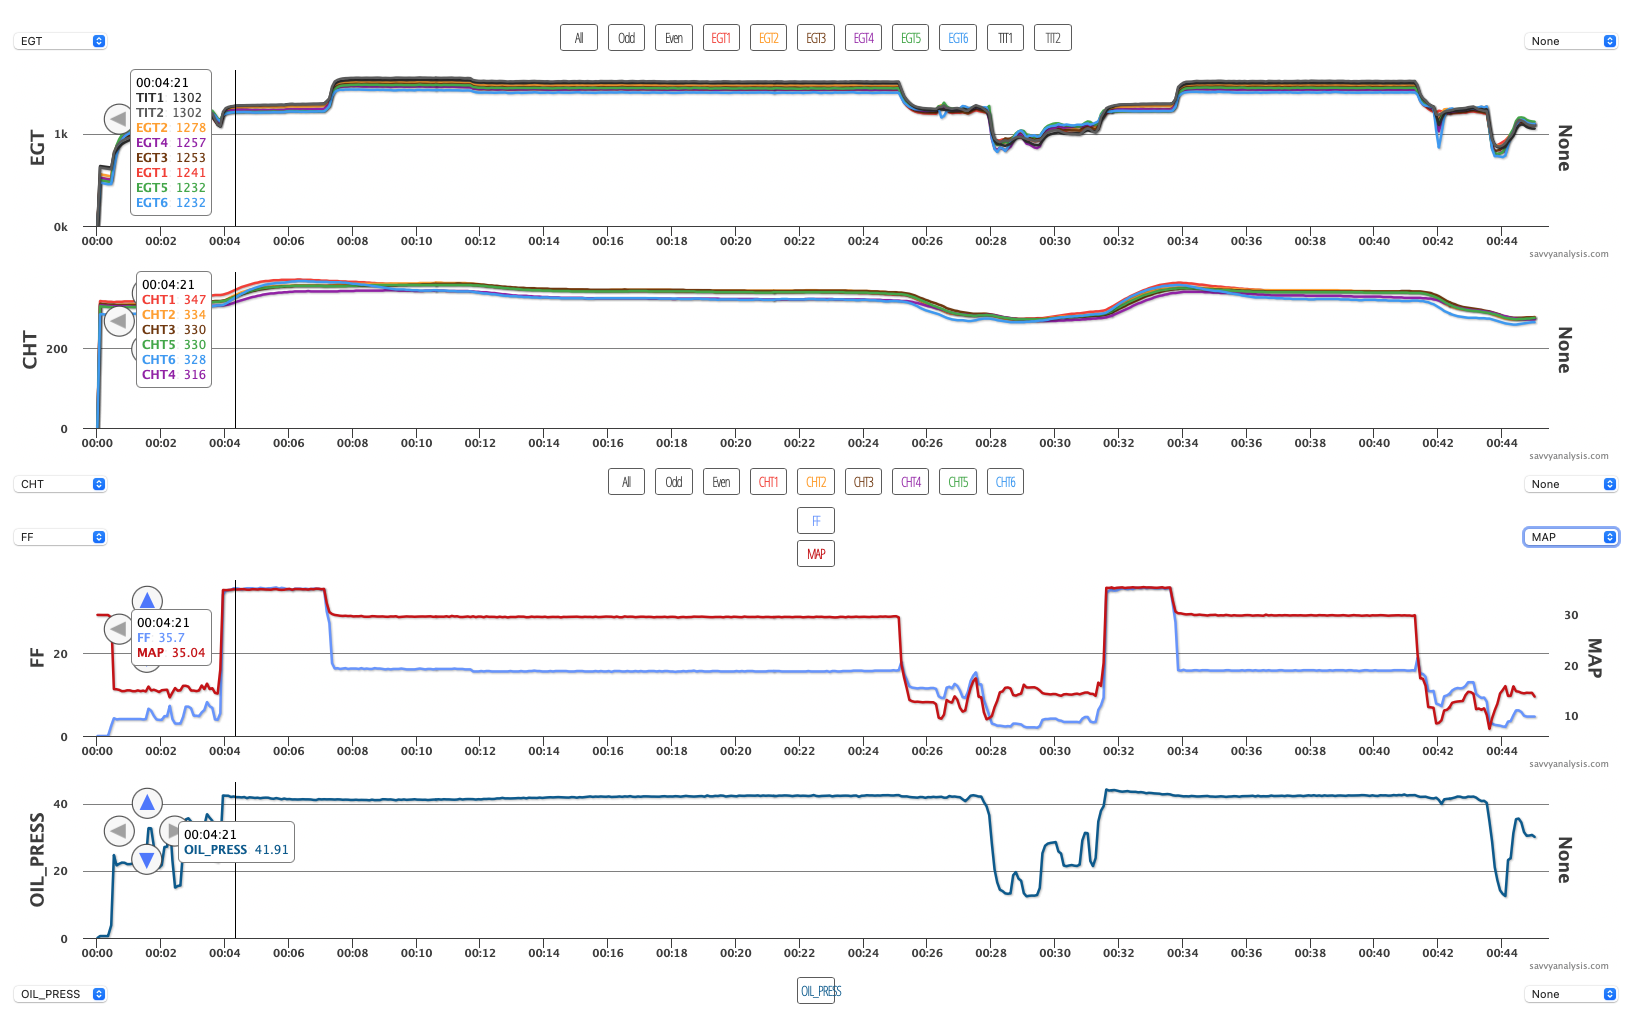
On the next flight, trouble ensues —
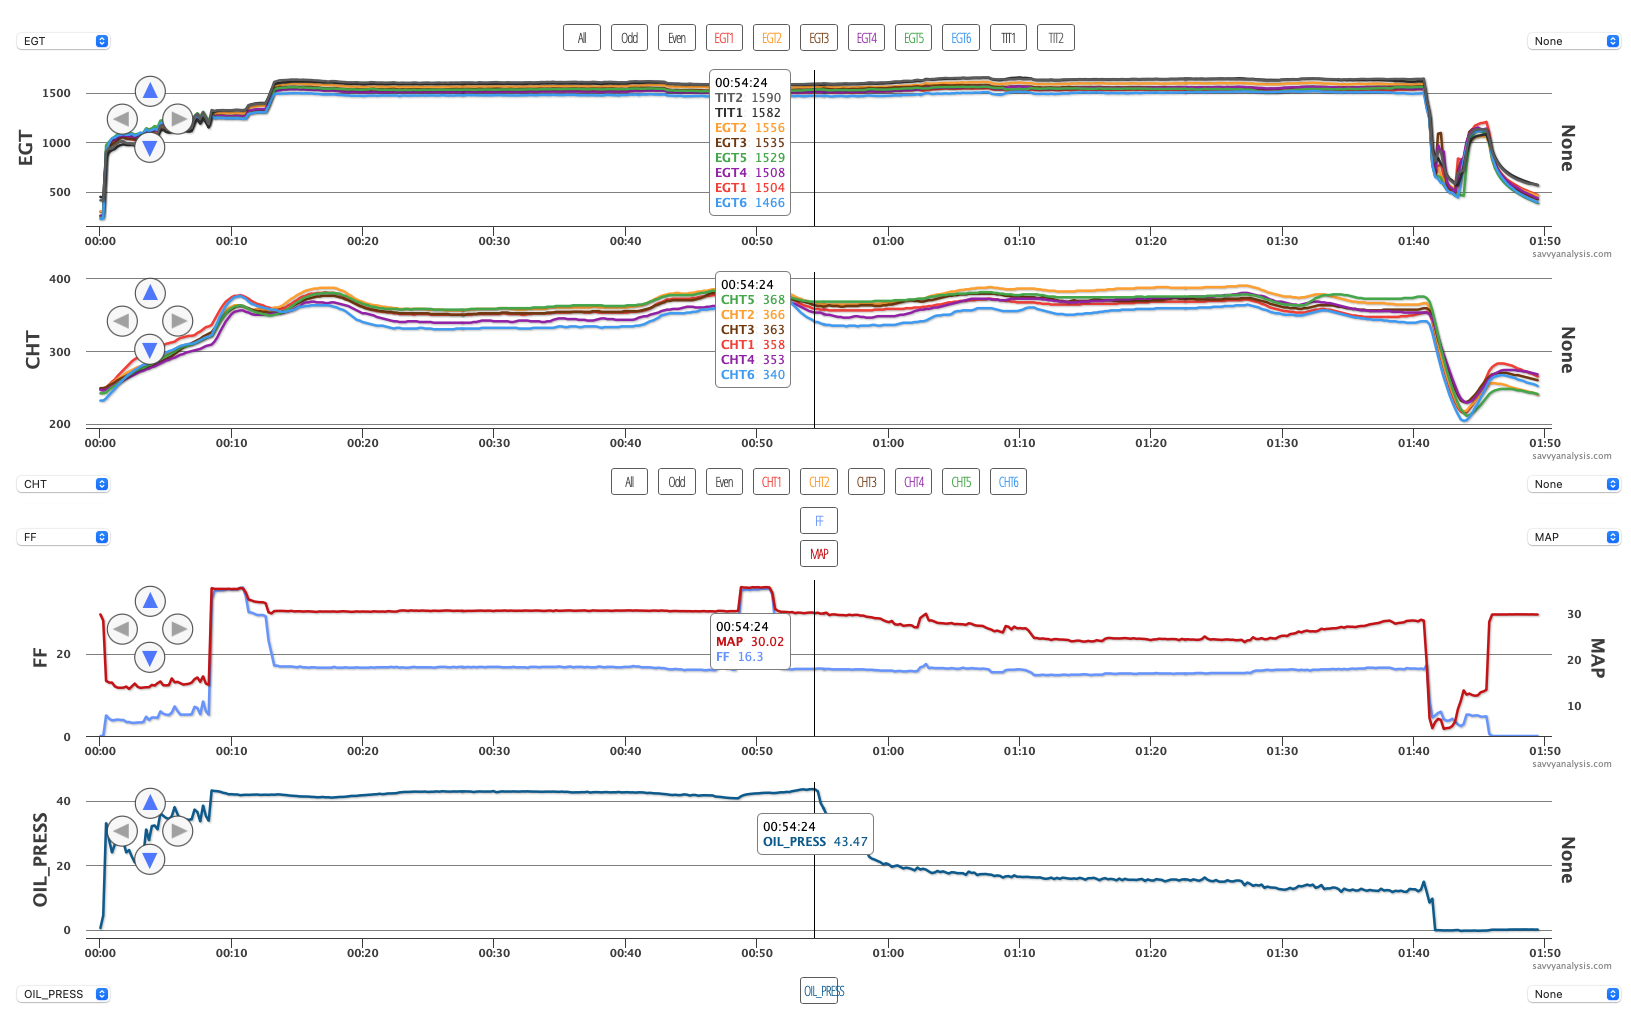
The first 55 minutes are like the previous flight, then oil pressure drops to below 20, and MAP drops to the mid-20s. GPS altitude indicates 11,000 so MAP is higher than ambient, but has clearly dropped. With no great options for a precautionary landing, the pilot continued on his destination – which happened to be where the shop that had performed the 50 hour inspection was located. When he landed and went to idle power, oil pressure dropped to zero.
He landed with 3 quarts of oil. They found metal pieces in the filter and but turbos were destroyed. The check valve that had gone in backwards had stopped oil from lubricating the main bearings of the turbos. Once they got oil again, they kept contributing until they failed.
Fortunately for our client, the shop stepped up and ate the cost of the tear-down and overhaul. The 2019 SR22T had 154 hours on the airframe and engine when the check-valve went in backwards.