The Greek poet Archilochus wrote, “The fox knows many things, but the hedgehog knows one big thing.” I’m reminded of this when clients ask “Which engine monitor should I buy?” Savvy doesn’t endorse brands or product models, so without naming names, we think the best choice is the one that reliably gives you the information you want in real time and then makes the download/upload process easy to accomplish.
On that last point, I know some clients want a system that automatically connects to a wi-fi network and seamlessly uploads new engine data as they taxi down their hangar row. For me, downloading to the thumb drive comes right after mixture and mags, and before master off. Whichever model gets you to do it – that’s the one you want.
To generate a report we use EGT, TIT, CHT, FF, RPM, MAP, Oil pressure and Oil temp, OAT, and Bus Voltage – x2 on a Cirrus. GPS Altitude is nice to have to verify what looks like a climb or descent. Sometimes Fuel Pressure is helpful when diagnosing a fuel issue. Carb temp is often helpful when ice is suspected. Those parameters pretty well define the hedgehog monitor, at least from the engine data analysis perspective.
Some of the newer monitors are foxy. All your autopilot and flight director moves are tracked. You get AHRS information, which frequencies the COM radios are tuned to, lots of NAV information, and pitch, roll and yaw information. All useful information in a forensic setting, but not much help for firewall-forward diagnostics and maintenance. We worked with the vibration data gathered by one model – but in the end we couldn’t reliably connect the dots and add value to our report. Gadget nerds that we are, we’ll keep an eye on developments in the fox world, as we continue our hedgehog persistence.
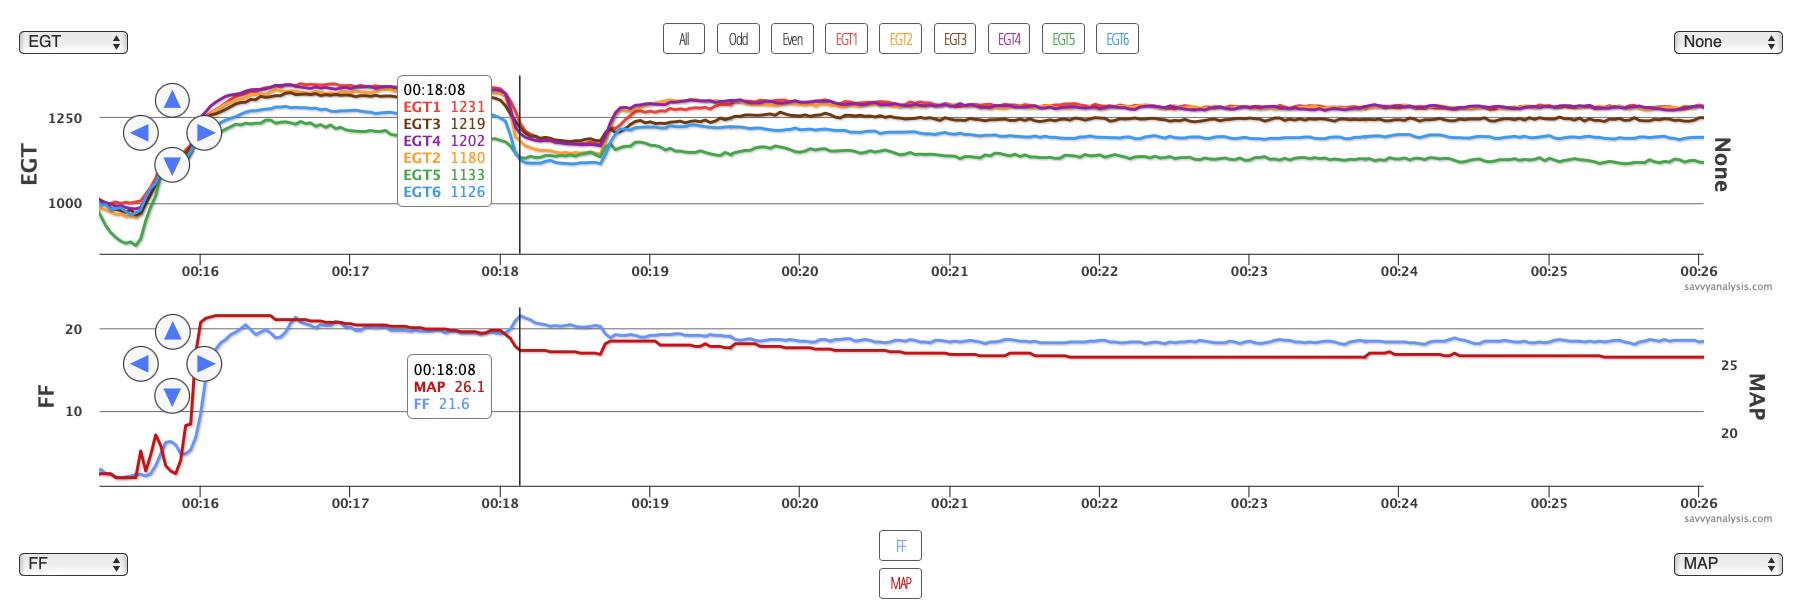
We’ll start this month with data from a Piper PA-28R-200 Arrow II powered by a Lycoming IO-360 and data from a JPI 900 with a 6 sec sample rate. EGT, CHT and FF. Cursor is not on anything special – just parked out of the way.
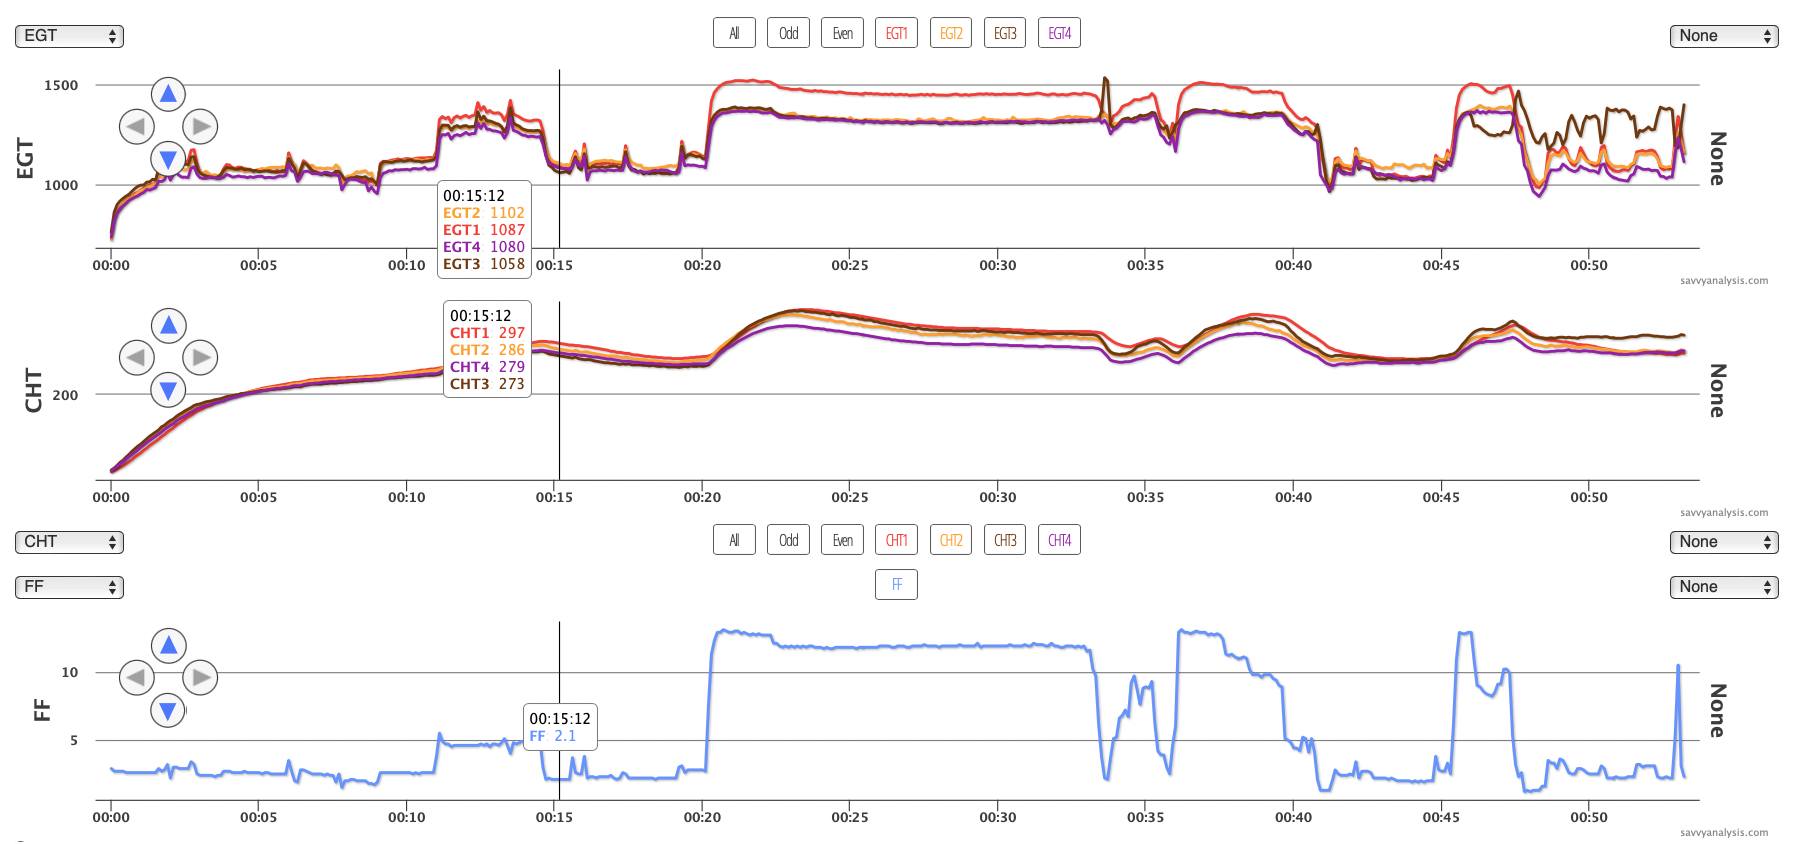
Two things jump off the page. EGT 1 is high while CHT 1 is a little on the high side but still with the others, and there’s a big jump in EGT 3 at 34 mins, then it’s normal again until the third takeoff at 46 mins. EGT 1 had been high on previous flights. But the spike in EGT 3 was new.
Full disclosure, the anomaly had already been detected when we got this data. And to be honest, it wouldn’t have been the first thing we thought of – but knowing what we know, all the clues are there. Here’s what happened.
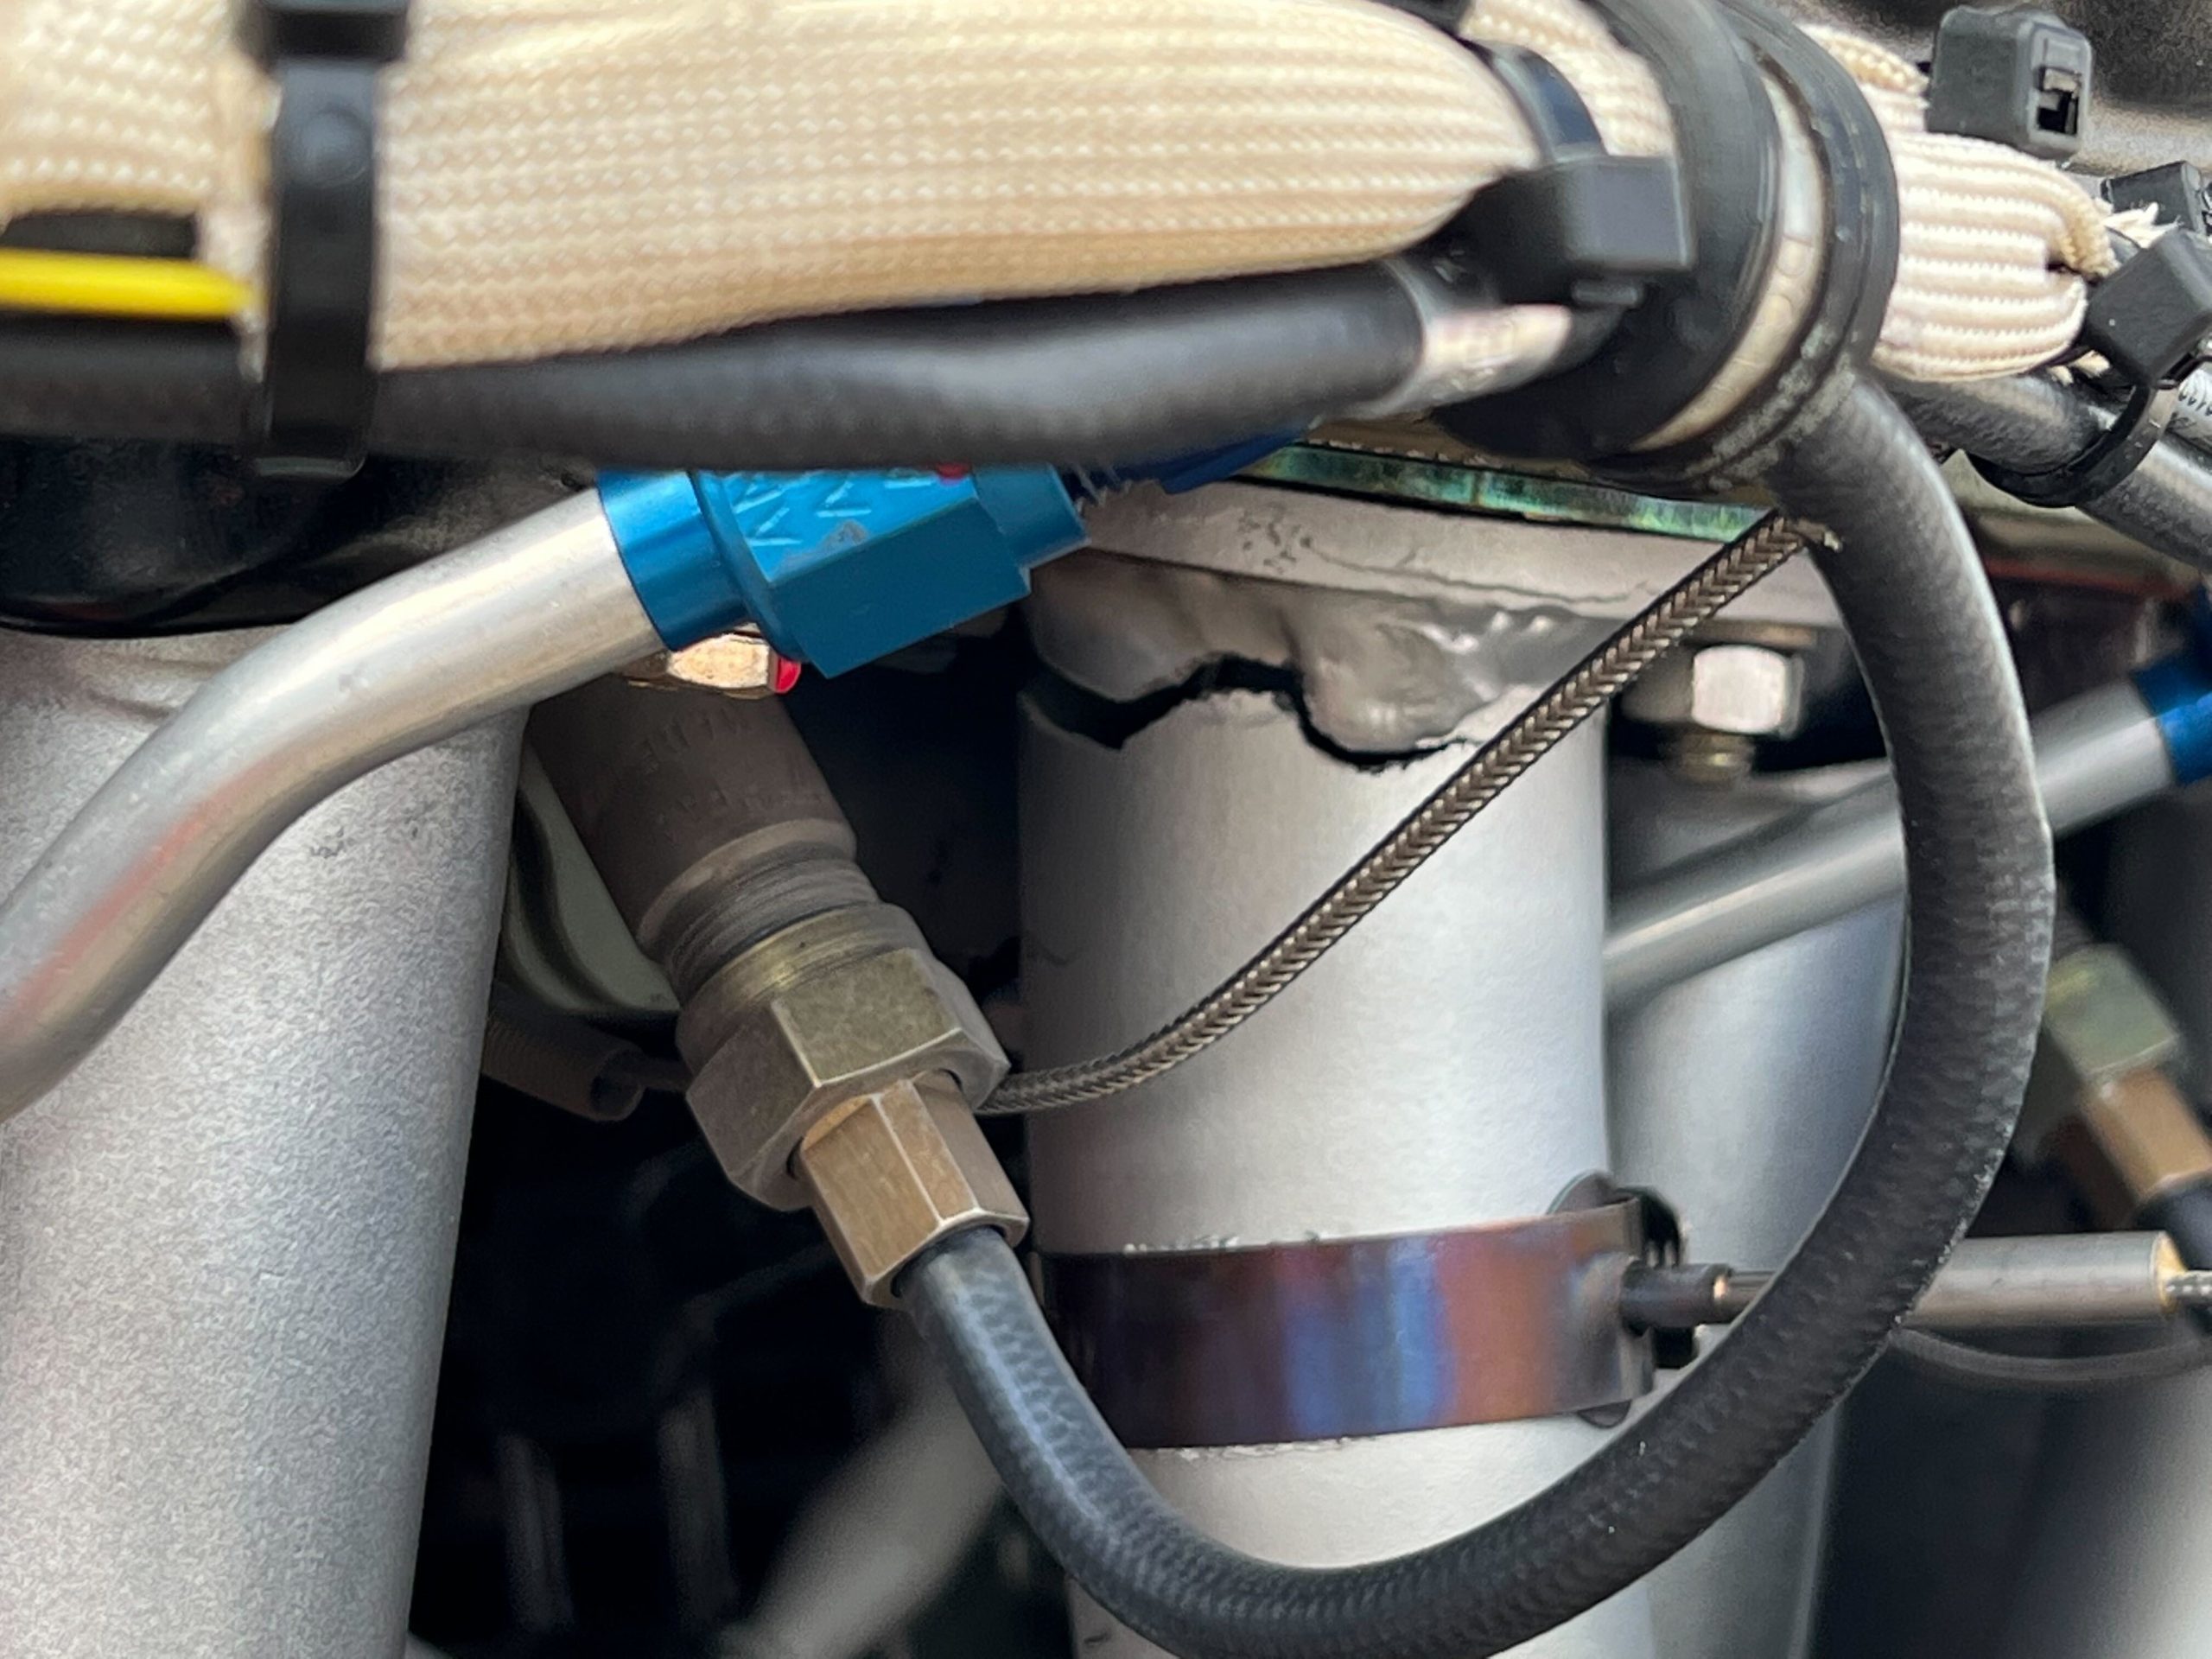
That’s the exhaust riser for cyl 3. We think there was a small crack, and at low power most of the exhaust went down the cyl 3 pipe. At higher power, the higher volume of escaping exhaust got wafted aft heating up the cyl 1 pipe and making EGT 1 read higher. You can see a little test of that theory during the runup from 11-15 mins, and again at the low FF settings in the 35 and 40-44 min ranges.
It looks like the pipe cracks just after takeoff at 45 mins. Our theory about the spike at 33 mins is that’s when the wheels touch the pavement, and that may have jostled the crack – although EGTs 1 and 3 look about the same before and after that event. Here’s the rest of the story.
About 30 hours previous, the engine had a major overhaul with everything new or rebuilt – EXCEPT the exhaust system. New muffler cans were installed about 2 years ago, but the rest had about 1900 hours over 30 years in service. The welders among you may have spotted a not so great repair. We concur.
Next up is data from a Cessna 182R powered by a Continental O-470 and data from a JPI 900 with a 6 sec sample rate. This is takeoff data for three different flights. CHTs don’t really tell us anything so here are EGTs, then FF and MAP for each flight, with the cursor marking the reported vibration event for each flight.
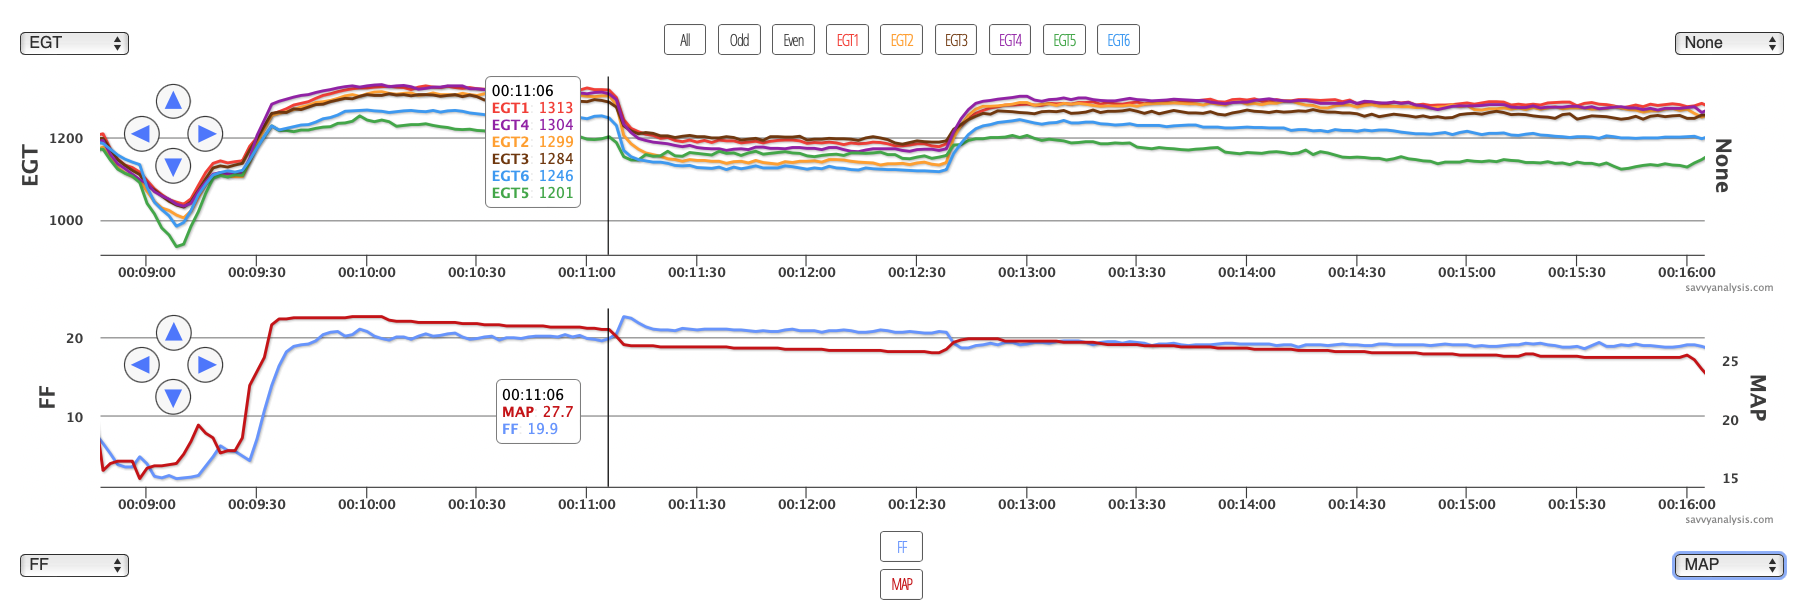
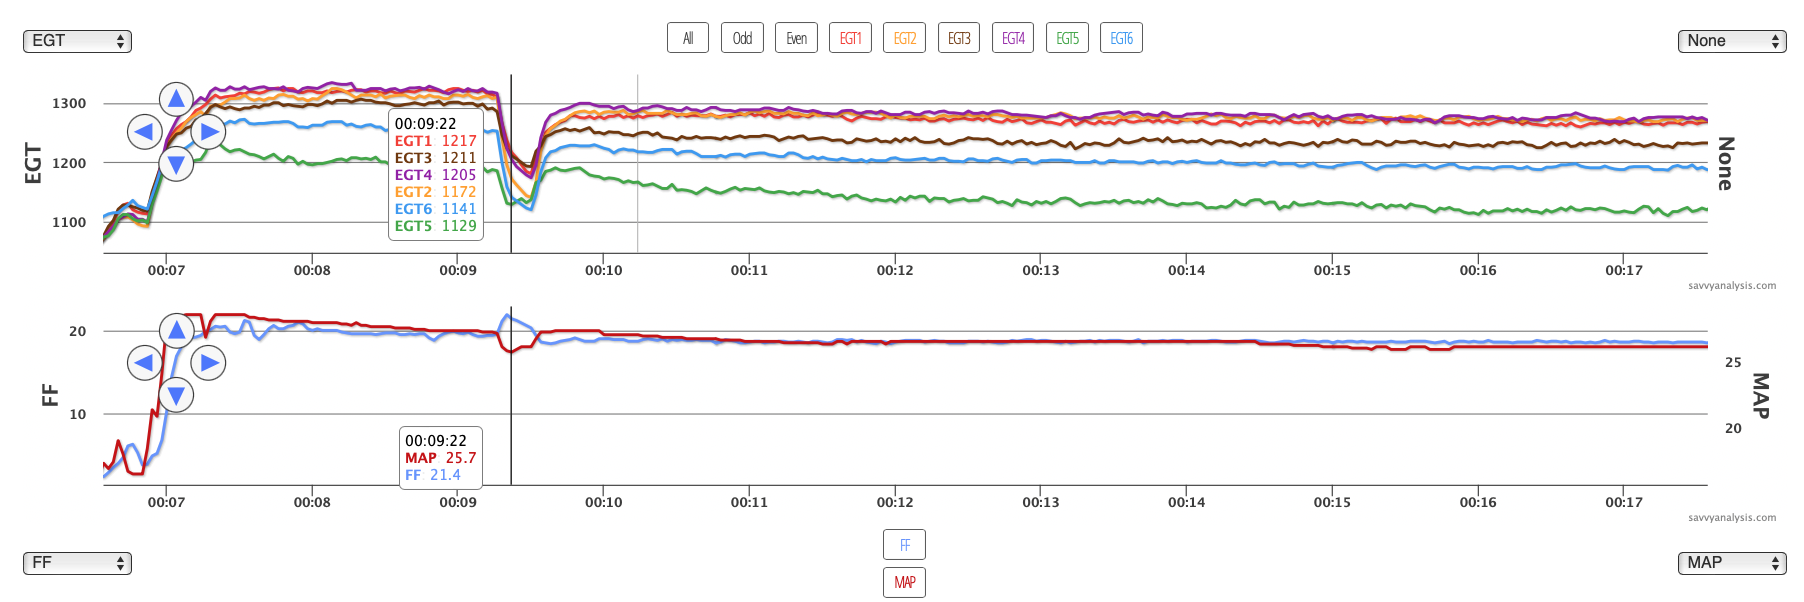
Here’s the scenario. A couple of minutes into the climb on each of these flights, there’s a vibration and an uncommanded drop in MAP and a slight rise in FF – corroborated by a drop in EGTs. In each case the anomaly resolves itself and FF and MAP resume their previous trend line. Another wrinkle – or maybe a clue – is that each of these was the second flight that day. No issues on the first flight.
To our eyes it wasn’t “textbook” anything. Ignition, fuel, spark, carb ice – none seemed like the place to start. Earlier in the year one of the mags had been found to be 34º BTDC, so the plugs were changed out and everything got a fresh once-over.
So we were asking the questions you may be asking. Why the second flight of the day and not the first? Why a couple of minutes after takeoff? On high-wing Cessnas when FF drops you have to consider a venting issue, but here it’s not dropping – it’s rising. And MAP is dropping. Did whoever or whatever caused that mag to slip to 34º leave another Easter egg for us to find?
As we mulled these questions, our client had the prop and governor examined. In the course of looking around, someone noticed that the muffler flame cone was…not airworthy. Once it was fished out of the muffler it looked like this.

This time it’s harder to say all the clues were there, but the second flight of the day makes sense when you consider that the loose part acted different whether hot or cold. It’s still a little puzzling how a blockage on the exhaust side of one side of the engine would impact induction – and in turn FF and MAP – for the other side. But in the process of suck, squeeze, bang and blow – if blow backs up then suck is impacted, and with less air to burn, the mixture got richer.