When the analysis team started looking at engine data about 10 years ago, we could confidently recognize the patterns for clogged injectors, spark plug misfires and detonation events. Other patterns, like broken valve springs and induction leaks, came later. Last month the analysis team began reviewing borescope pictures. Just as with engine data, some conditions are easy to spot. And I’m confident that, as we gain experience will be able to identify more anomalies, and take advantage of the synergy of having pictures combined engine data.
We’ll start this month with data from Cessna 210 powered by a Continental IO-520 and data from a Garmin 275 with a one second sample rate. This is a 30-minute segment of an hour-long flight – displaying only EGTs.
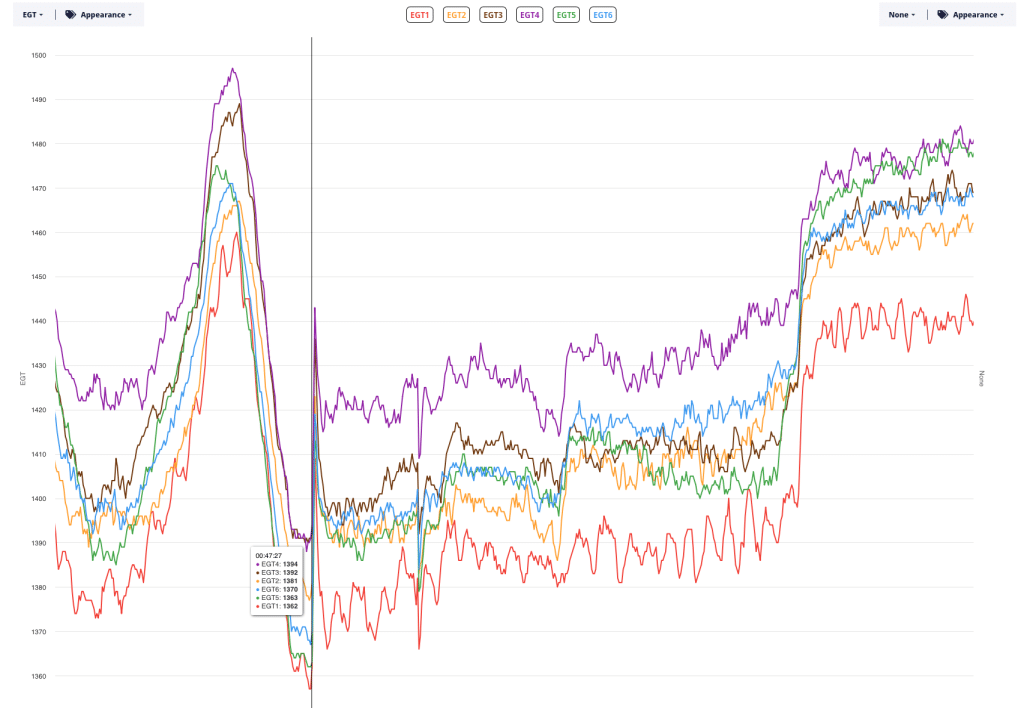
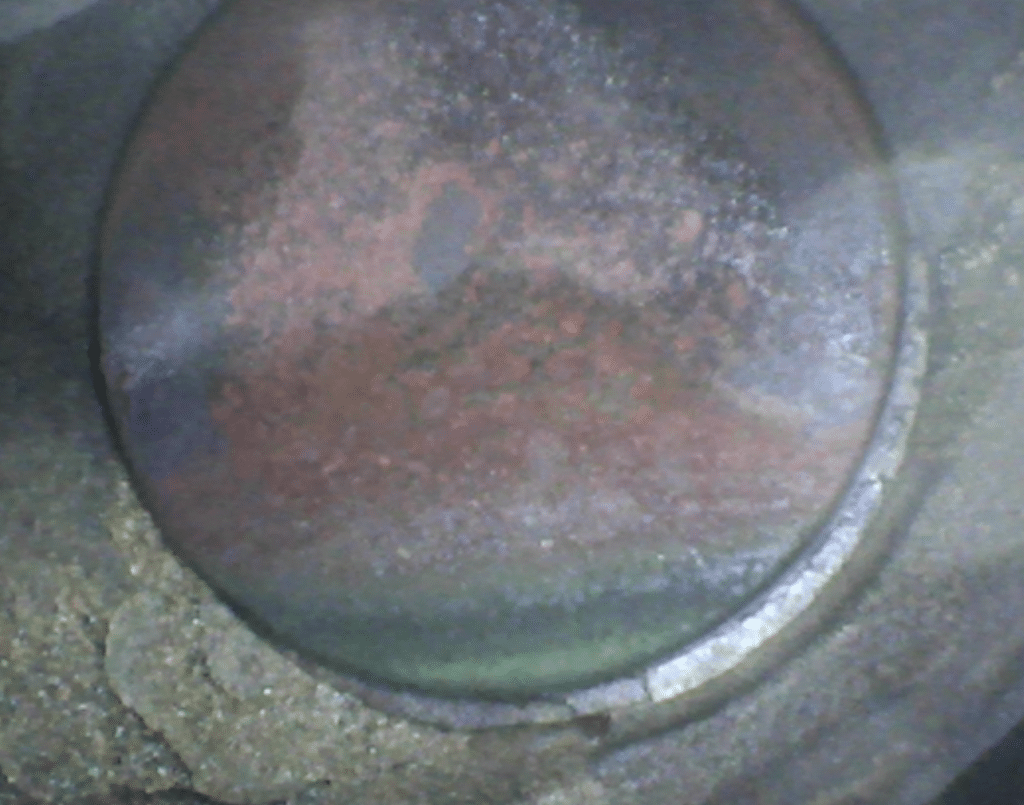
All EGTs are a little noisy, but there’s a distinct and recurring pattern in the red trace, which is EGT 1. The original FEVA 1 algorithm scanned for this pattern. FEVA 2.1 uses a machine-learning algorithm designed to spot exhaust valve failures earlier in their demise. Both algorithms spotted this one.
That green spot means this valve is too far gone for lapping compound to bring it back.
Next is data from a Cessna 320 Skynight powered by Continental TSIO-520 engines with data from an EI CGR-30P with a 1 second sample rate. This is EGTs, CHTs and FF for the left engine. Yep, it’s a 7 hour flight.
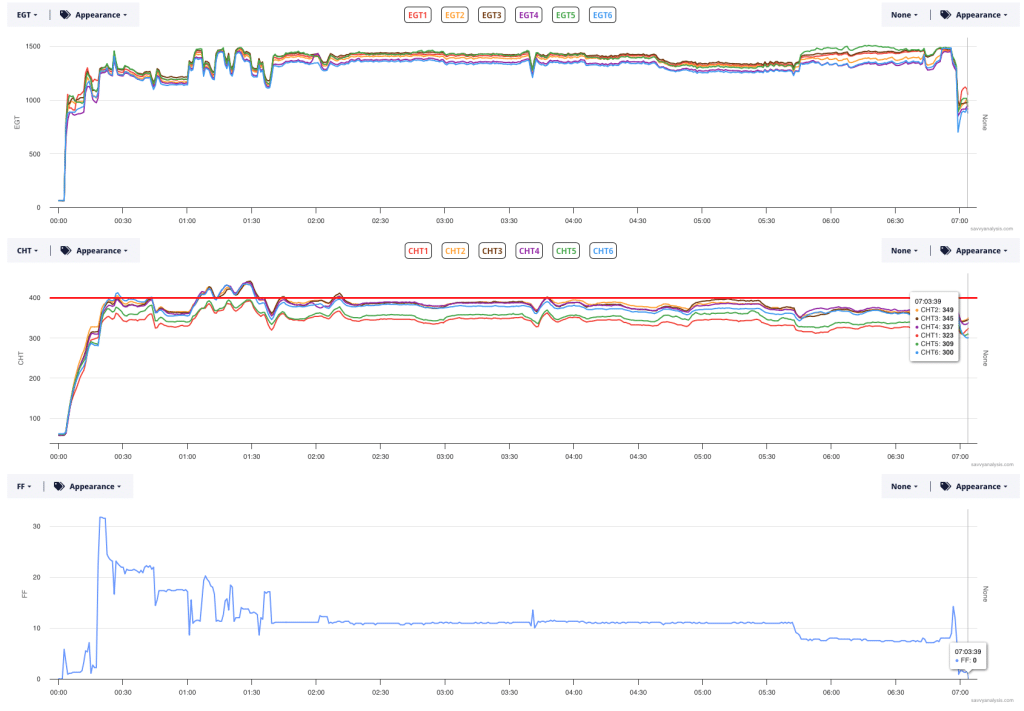
Even zoomed out you can see a gap in CHTs, with 1 and 5 running cooler. And there’s some daylight in the EGTs too. Here’s the same data zoomed into the first 90 minutes of cruise. FF is steady at about 11 GPH so didn’t display it.
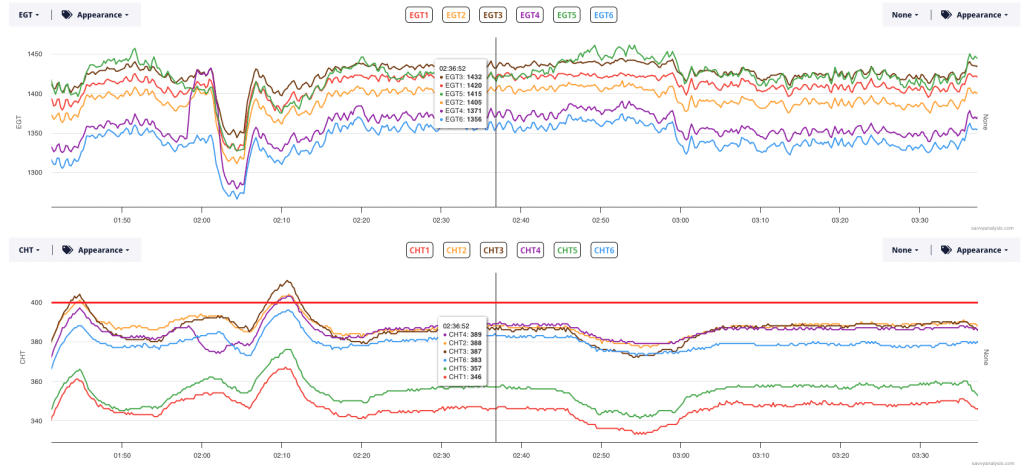
Now it’s easy to see that EGTs 1-3-5 are grouped together, with 2 just under them, and 4 and 6 lower. The CHT pattern is slightly different, with 1 and 5 low and 3 up with 2-4-6. When each bank of cylinders moves as a group and the range of the group is different than the other side of the engine, we suspect induction. But which side?
EGTs 1-3-5 are hotter but two of three CHTs are low – quite low. It’s pretty much the mirror image for the other side. We think the case is stronger for the leak on the 2-4-6 side, since lean of peak EGTs are low, and CHTs are higher because of the leaner mixture. But it wouldn’t hurt to check both sides.
Next is data from a Grumman Tiger powered by a Lycoming O-360 engine with data from a JPI 730 with a 6 second sample rate. This is the whole 21 minute block to block. Nothing special about cursor placement – I just chose the highest range of CHT 4.
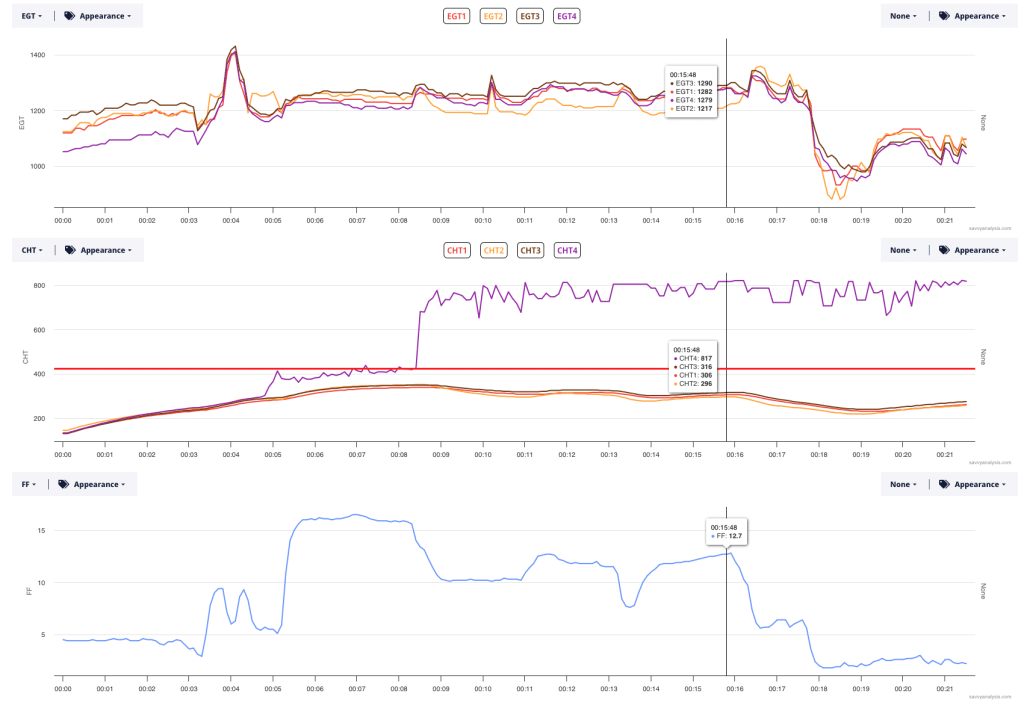
The big elephant is the purple trace of CHT 4. When we see a big jump like we see here we look for corroboration in the other data. EGT 4 moves up a little bit but nothing like the move in CHT, while FF drops from the climb setting of 16 GPH to the cruise setting of 10. So we have concurrent movement, but nothing that looks like corroboration or cause and effect. Here’s the CHT 4 data by itself.
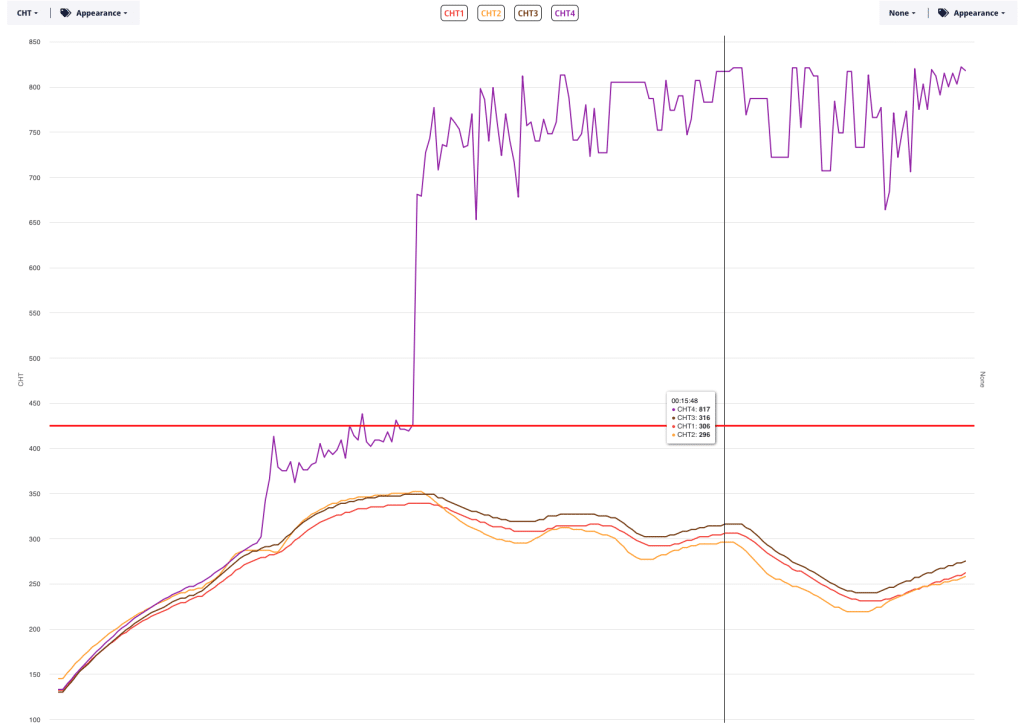
The first move seems almost plausible – if an exhaust gasket blew and was torching the CHT probe. It seems like we would see a bigger move in EGT 4, though. But the second move to the 700-800º range – instantly – doesn’t seem plausible. So is it a loose connection or a failed probe?The data never really drops down to zero. There’s always some non-zero number logged. So we think this is a probe failure. often with a pro failure, we see little blips in the data from earlier flights. We didn’t see that.
Here’s the kicker. The owner took it to the shop and connections looked good. The plan was to replace the probe, but they made a flight before the probe got swapped out. And the CHT 4 data was normal. This would sure get your attention in real time, huh? Except you might be able to make the argument that if it had climbed to 400º and stayed there, you’d be worried, but when it climbed to 800º and stayed there, it would be easier to dismiss as bogus.
We’ll finish this month with a Siai Marchetti S208 powered by a Lycoming O-540 and data from a Garmin G500 with a 1 second sample rate. Here’s EGT, CHT and FF for the 48 minute flight.
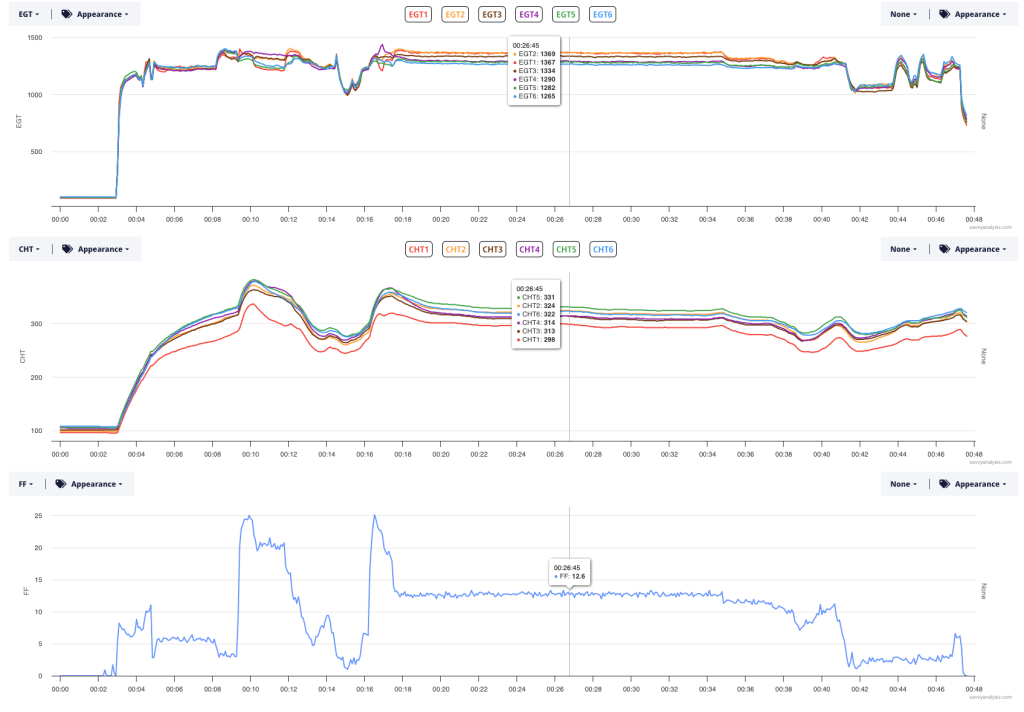
Do you see the trouble? Aside from CHT 1 being a little low, and its EGT being a little high, the data looks pretty good. Agreed – the point was to show you that the engine data was normal, but the electrical data was a different story.
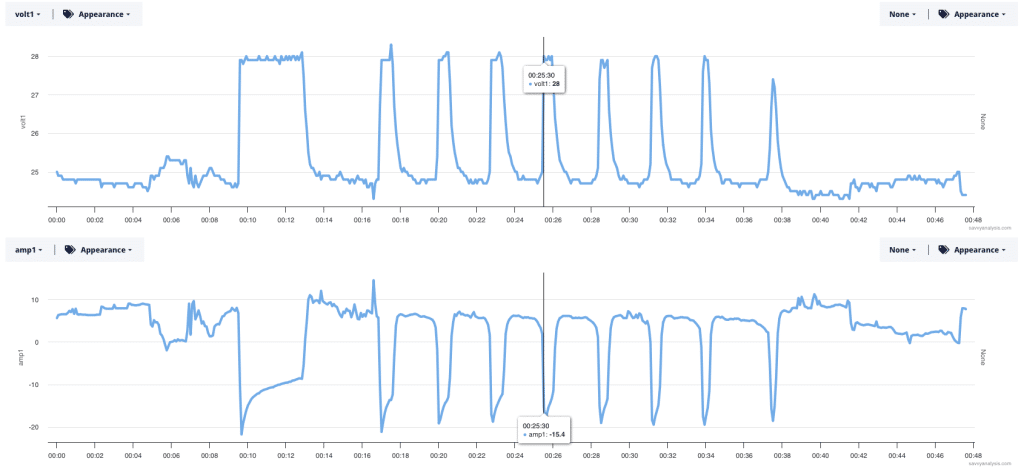
This is Volts and Amps for the same 48 minute flight. Where to start? Is it bad data? No because the Volts and Amps basically corroborate one another. Is there a correlation between power (high/low) and the occurrence of the cyclic pattern? Yes and no. No because the pattern cycles after the power reduction at 18 minutes when FF isn’t changing. Yes because at idle Volts are low, and when power is higher than idle Volts are either normal or cycling.
It’s easy to imagine racking up the hours with a multimeter measuring values between one terminal and another, with the engine idling. Fortunately, this one was a lot easier to solve. When the cowl came off it was easy to spot the loose alternator belt.