I’m not spoiling the movie if I tell you that one of the opening scenes of Top Gun: Maverick is a pilot swinging a wrench on an owner-flown piston-powered warbird. That may be enough to make you want to see it, although from the box office numbers so far they don’t need help filling seats. The camera point of view is from the other side of the plane, so naturally the engine data geek in me wondered if he was changing out a faulty probe for his state-of-the-art digital engine monitor. Hey, a guy can dream.
It’s tempting to go off on a rant about how GA is often depicted in the movies, but that’s not why you’re here. So let’s look at some data from recent flights.
First up this month is data from a Cessna 172RG powered by a Lycoming IO-360 and data from a JPI 700 with a 6 sec sample rate. Cursor is on the beginning of the CHT 3 excursion. FF is logged in liters per hour – 46 LPH is 12.1 GPH.
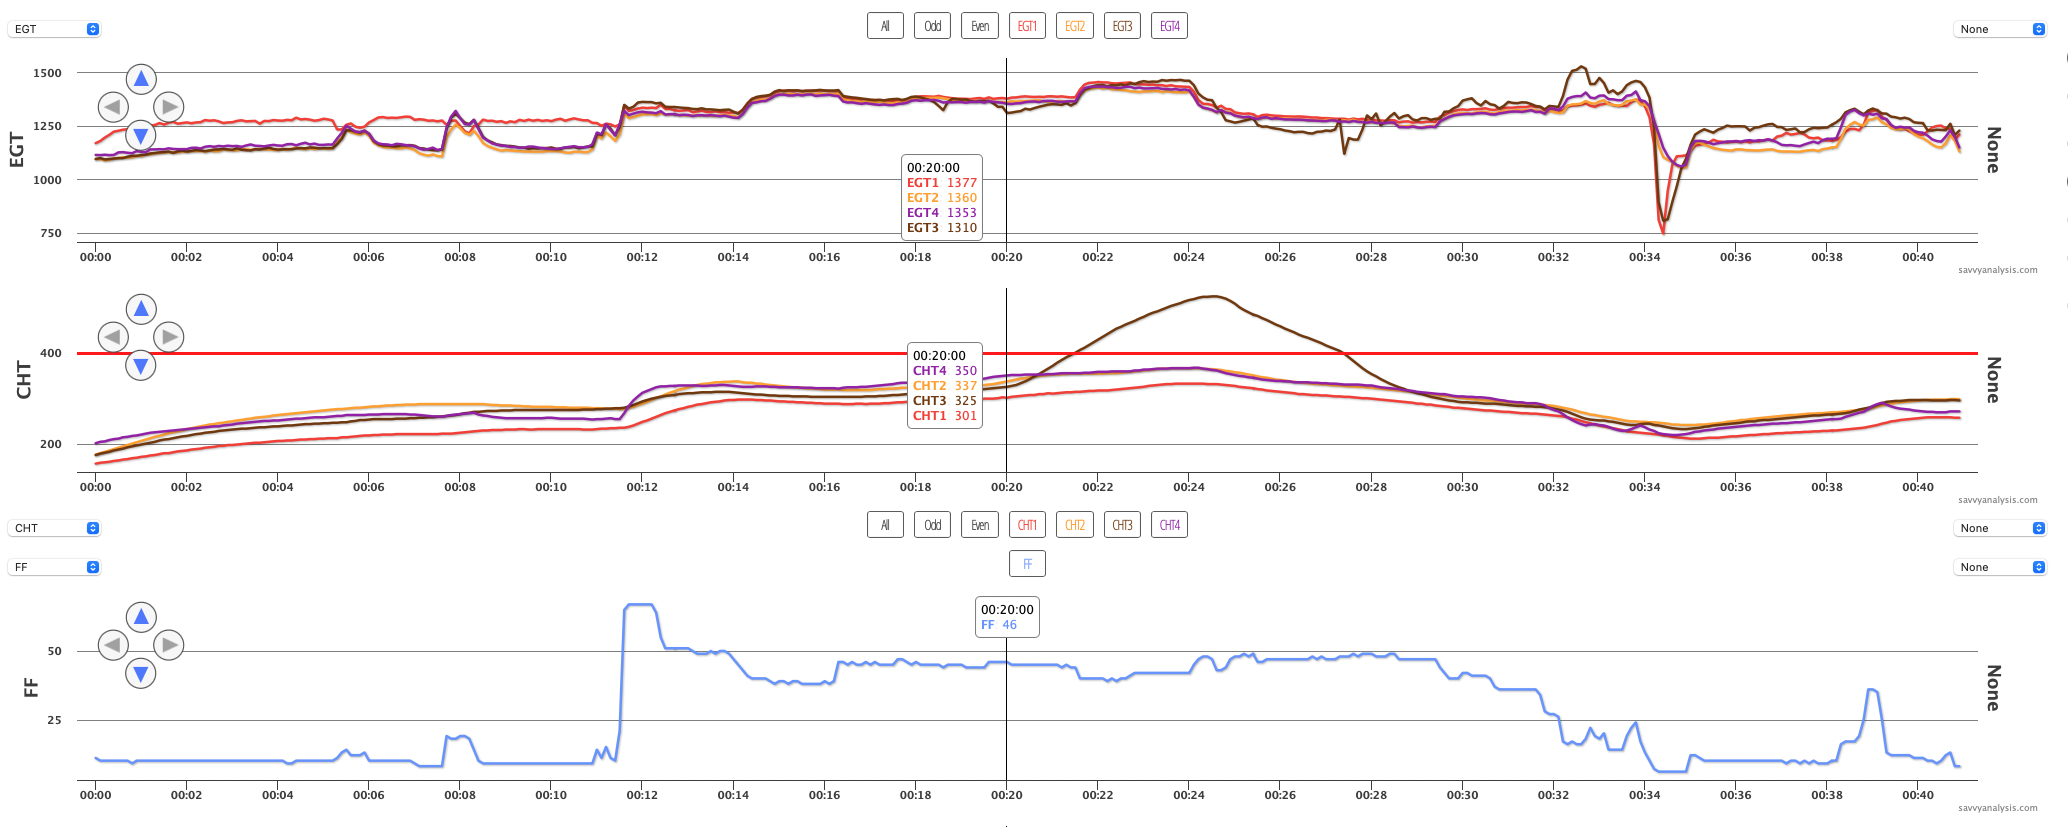
That climb in CHT 3 is from 325º to 525º – exactly 200º – in just over 4 minutes. Can we trust that it’s real? EGT 3 had a misfire at 18 mins, then another around 20 when this event begins. Then after the event, starting at about 26 mins, EGT 3 is pretty erratic until shutdown. Oil temp isn’t depicted here but also rises along with CHT 3, so another tick in the “real” column. Plus, the accompanying analysis request confirmed roughness starting a few minutes after takeoff.
It’s a textbook detonation pattern in the CHT trace, at least on the “climb” side. Sometimes we see a faster drop in EGT and CHT after the peak, but that’s usually a result of a big change in FF – either way. Here FF goes up a little – about 1 LPH – which doesn’t conclusively impact the event. Let’s tackle two questions: was there a warning that this was coming, and could pilot action have ended it sooner?
CHT 3 looks normal until the trouble. EGT 3 had that misfire at 18, then looked ok again for a little while. Based on earlier CHT patterns, you might think cyl 1 would be the one to watch – not 3. So we think there’s not much warning in initial climb.
Could a healthy increase in FF right after the CHT excursion started have ended it sooner? No way to know for sure but we think so. Or, if altitude and terrain permitted, just pulling the power to idle might have ended the runaway. Fortunately, there was an airport nearby and from the CHT peak to wheels on the ground was less than 10 minutes.
Next up is data from an RV-9 powered by a Lycoming O-320 and data from a Garmin G3X with a 1 sec sample rate. CHT, EGT and FF – nothing special about cursor placement.
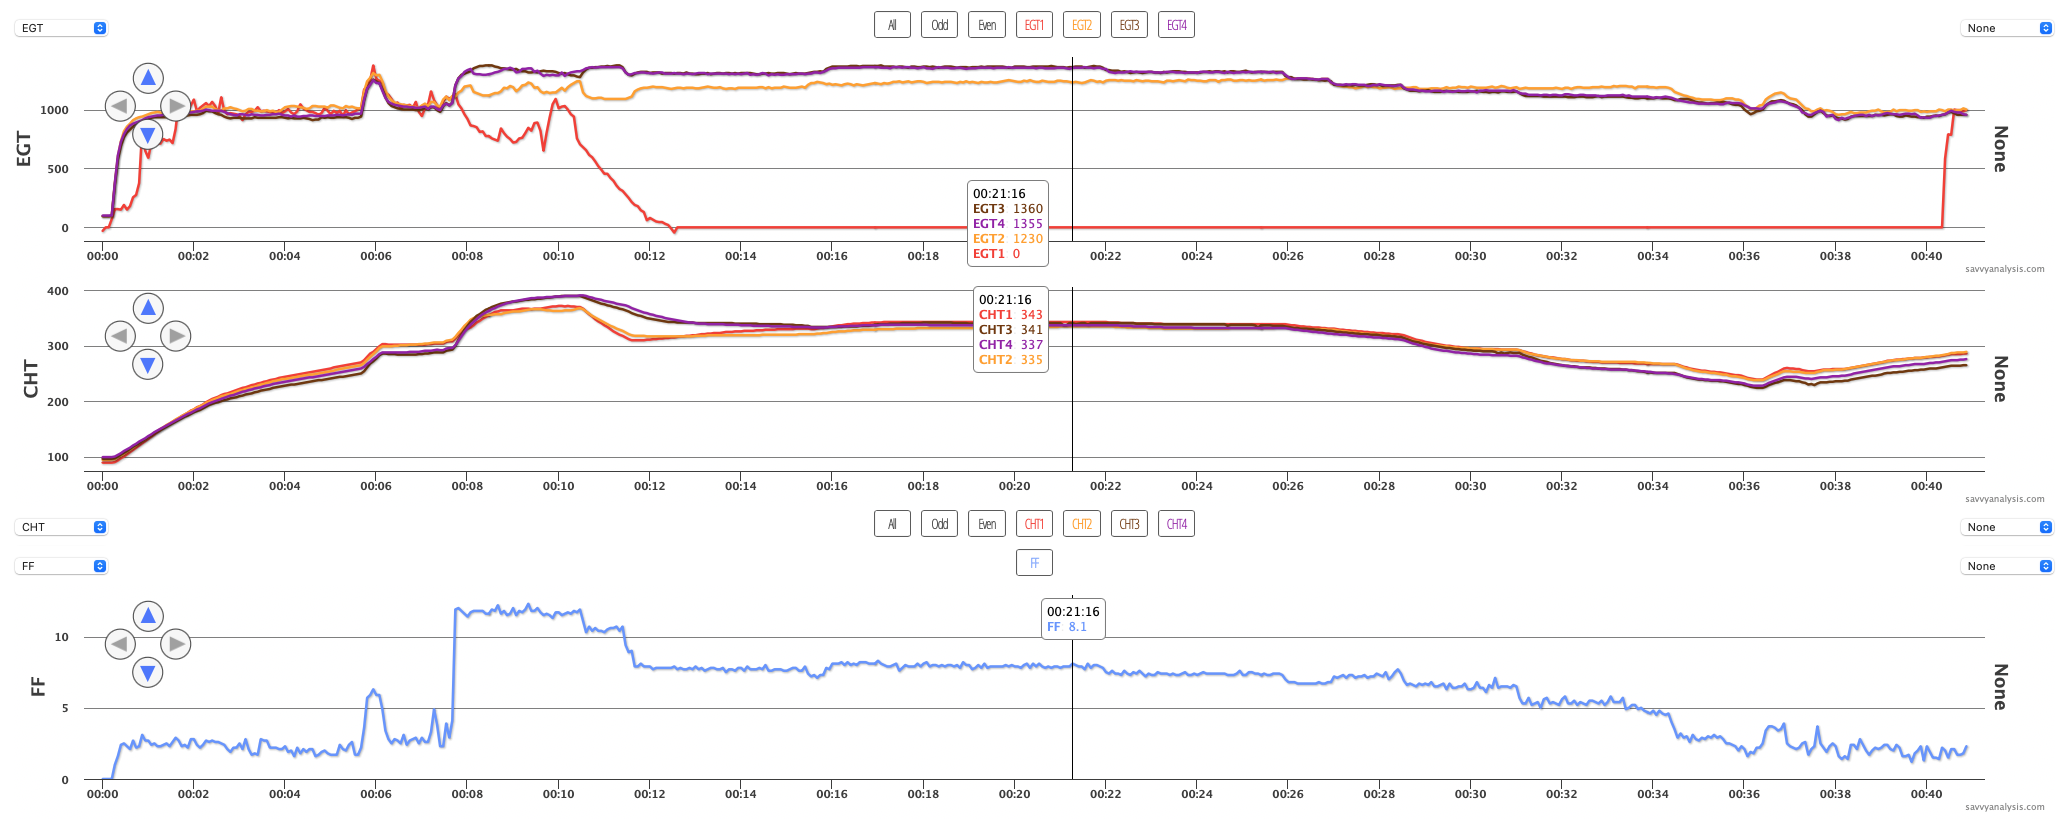
The problem is EGT 1, and right out of the gate. Almost looks like a valve is sticking, but the normal pattern for CHT 1 agrees against it. Then at 2 mins when EGT 1 joins the others, it’s jumpy while taxiing, and high in the mag check at the 6 min mark.
When takeoff power is applied and the others rise, EGT 1 drops. It had to be distracting for the pilot to look over and see it falling then rising then falling then falling some more – all while the engine was running ok and CHT 1 looked ok. 1 and 2 were lower than 3 and 4 but 1 was about the same as 2.
Then EGT 1 does something weird – that little dip just after the 12 min mark is a reading of -45º. Then it settles in at 0º, until the plot twist at 41 mins when it comes back to life after landing. Apparently the pilot decided he could safely ignore EGT 1 and press on. The airplane landed at an airport about 60nm from its departure airport.
Had the probe not come back to life after landing, we would suspect it had failed. Since it did, checking the connection was a good first step. It always makes sense to check the connection first, and especially with a data pattern like this.
Next up is data from a Beech Baron 58 powered by Continental IO-520 engines and data from an Insight G4 with a 1 sec sample rate. Display is L engine EGT with FF overlaid, then CHT, then the same for the R engine. Cursor is on a LOP cruise segment where all is well – so you could see the issue that’s about to occur.
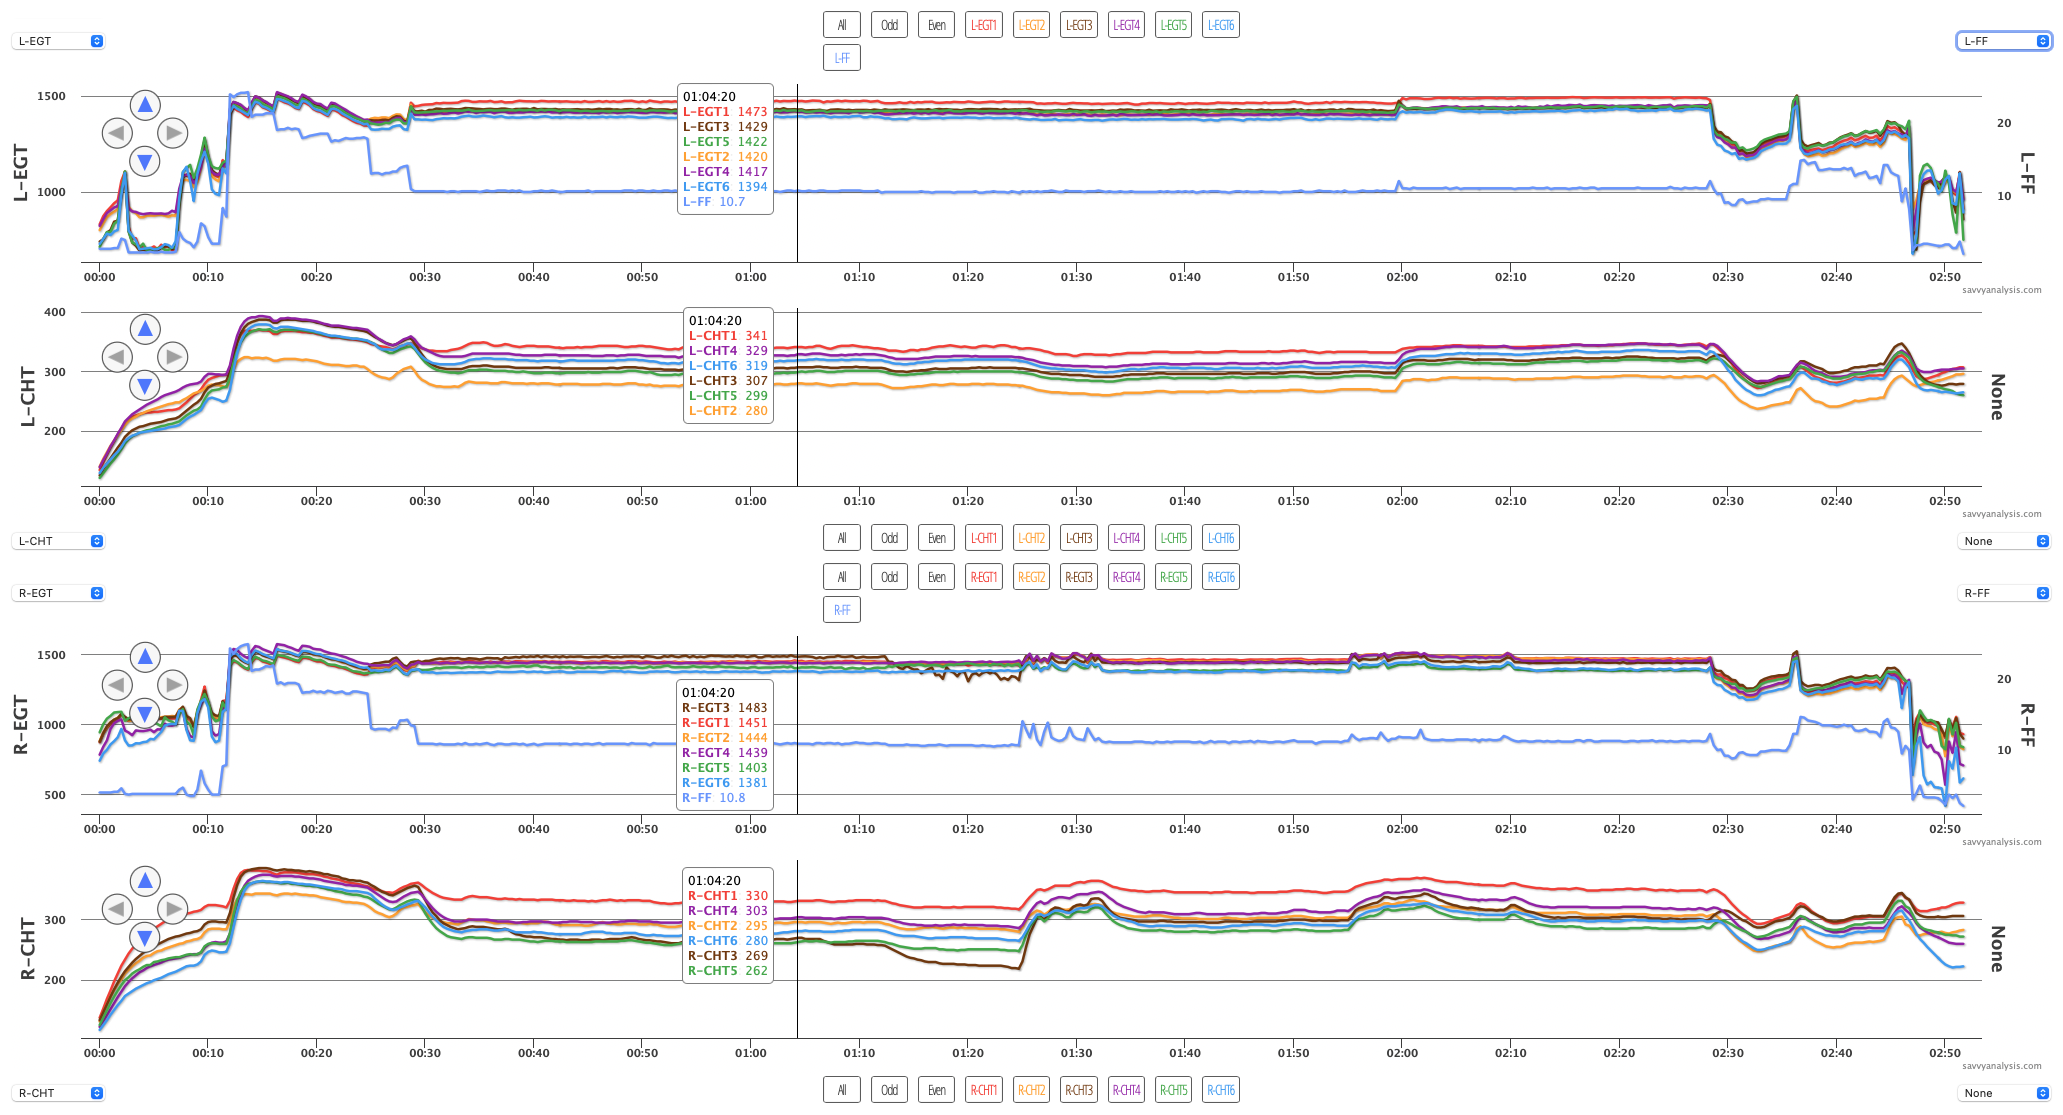
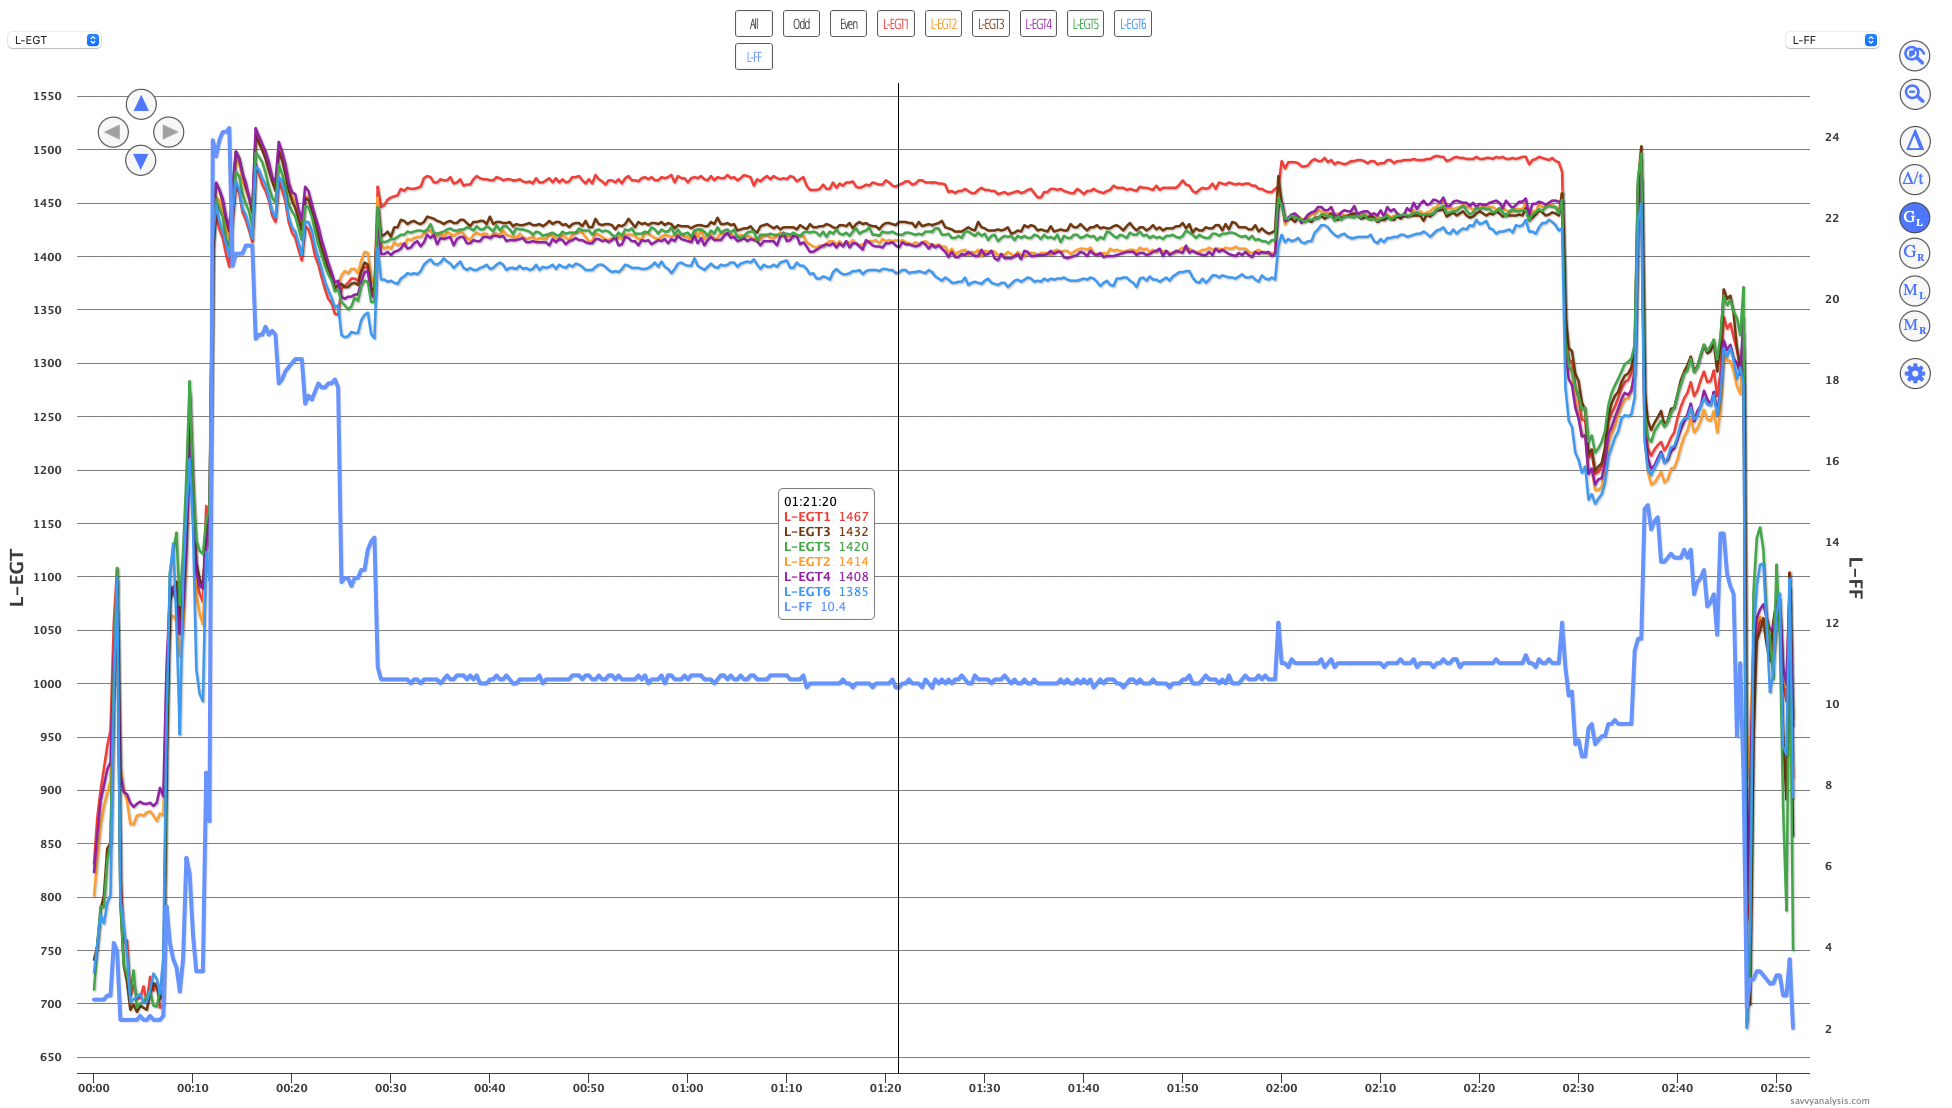
The analysis request said that the pilot had leaned for cruise, then at about the 1 hr 10 min mark had tried leaning each engine a little more. The L engine was ok leaning from 10.7 to 10.4 GPH. Here’s a screenshot of that, with a reminder that anytime you want to see EGT and FF together, use the Gami tool in the right column of tools – the one that’s blue in this shot. You don’t have to be measuring a sweep to use it.
The R engine wasn’t as happy about going leaner than 10.8 GPH. On the first move to 10.6 EGT 3 stumbles, and CHT 3 drops. He hangs in there for about 10 mins, in case maybe a fouled plug was going to clear itself. Didn’t happen.
So, suspecting a slightly clogged injector as the problem, he gave us a set of mixture sweeps.
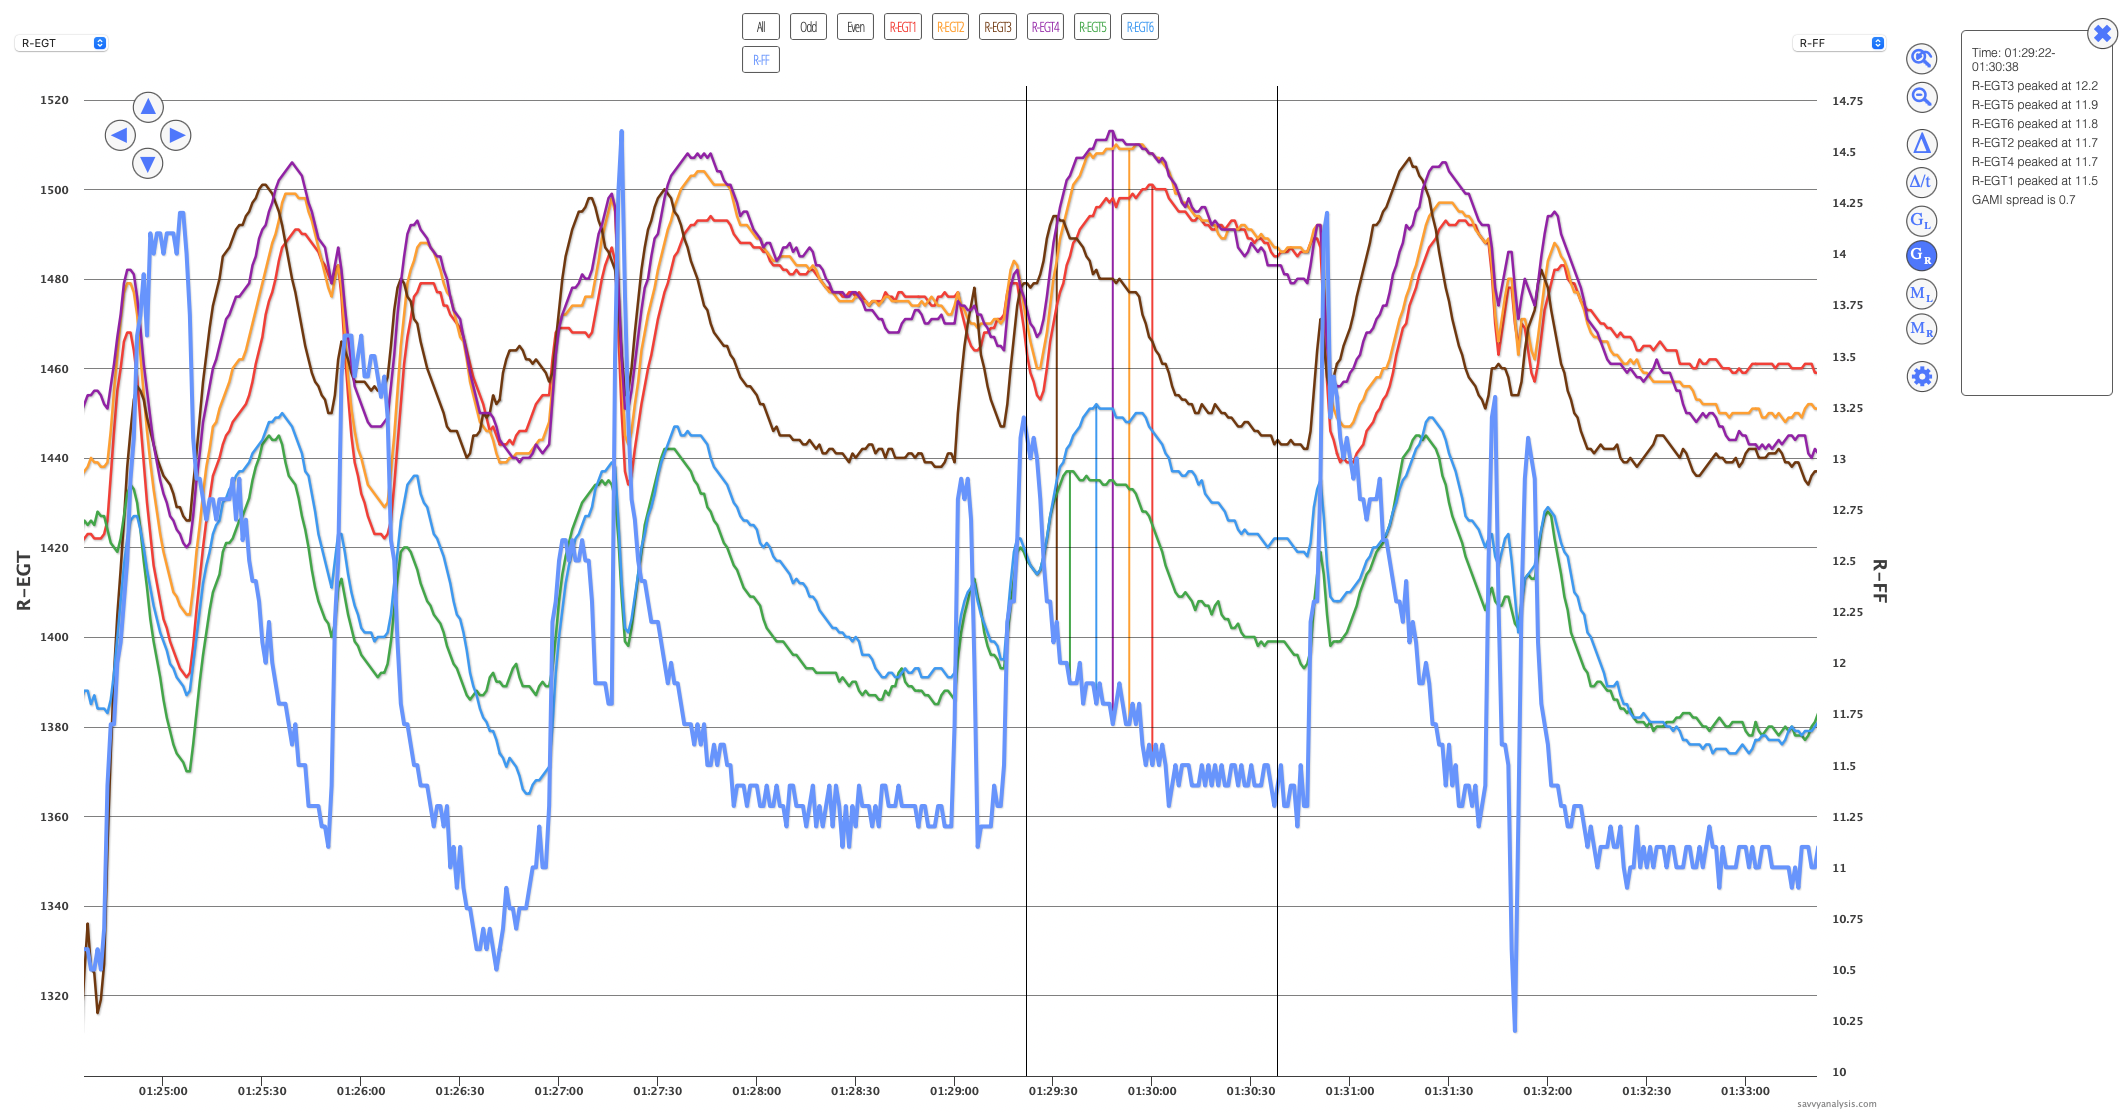
The GAMI spread numbers are in the upper right corner of the image, and confirm that 3 is peaking ahead of the others. Not by much, but it was enough to keep him from running as lean as he wanted to.
Maverick probably wouldn’t agree, but when you’re buying your own Avgas, sometimes you’re willing to give up your need for speed in pursuit of efficiency.