When it comes to troubleshooting issues with an aircraft engine, it’s probably safe to say that any engine data is better than no data at all. Data from cruise flights can tell us about the airplane’s normal operations, and when we have enough data from an airframe & engine cohort we can generate report cards and trend analysis reports. But when it’s time to gather specific information about mixture distribution and ignition system health, we use the Savvy Test Profile – a series of slow mixture sweeps, followed by a lean-of-peak mag check.
There are so many great resources for flight training now, in all media. When I was coming up in the ’70s and ’80s, we had print – and I had three favorite authors. For me, nobody told a story like Dick Collins, and I always finished one of his articles feeling like he had helped me set my bar for precision and professionalism. Rod Machado’s method of disarming your defenses with humor always worked on me. And Bill Kershner did something that I stole and used almost every day in fifteen years of classroom and online teaching. He would explain a concept, then tell you that “the rookie mistake on this is …” – which accomplished three things; if you made the mistake it was ok because it’s just what rookies do, it warned you what the rookie mistake was and probably kept you from making it, and if you avoided it, you got a sense of accomplishment to be smarter than a rookie.
This column is about the common errors we see in test profile data. In writing the instructions for the test we tried to anticipate questions and head-off confusion, and we’ll continue to amend the document as we become aware of the need for clarification. If you perform your own analysis using our tools, you might see something here that you wouldn’t catch on your own. If Savvy performs your analysis, this might help to submit more reliable data, or explain why we called data unusable. I thought about calling it Rookie Mistakes, because even a pilot with 10,000 hours and every rating can be a rookie when it comes to this test profile. And calling them mistakes is probably too harsh – they’re just errors. Also thought about jumping on the current hype-your-title bandwagon and calling it “The Most Dangerous Thing You Can Do With An Airplane” – probably great clickbait for SEO but not my style.
Before we get to data, when you sign up for any Savvy service, please let us know if your ignition configuration is the standard two-mag, or you’re fully electronic, or you have one of each. Since we look at the rise of EGT as part of ignition analysis, it’s important to know if timing is fixed or variable. And if you’ve already signed up and you change (this was a big year for electronic mags at AirVenture), let us know.
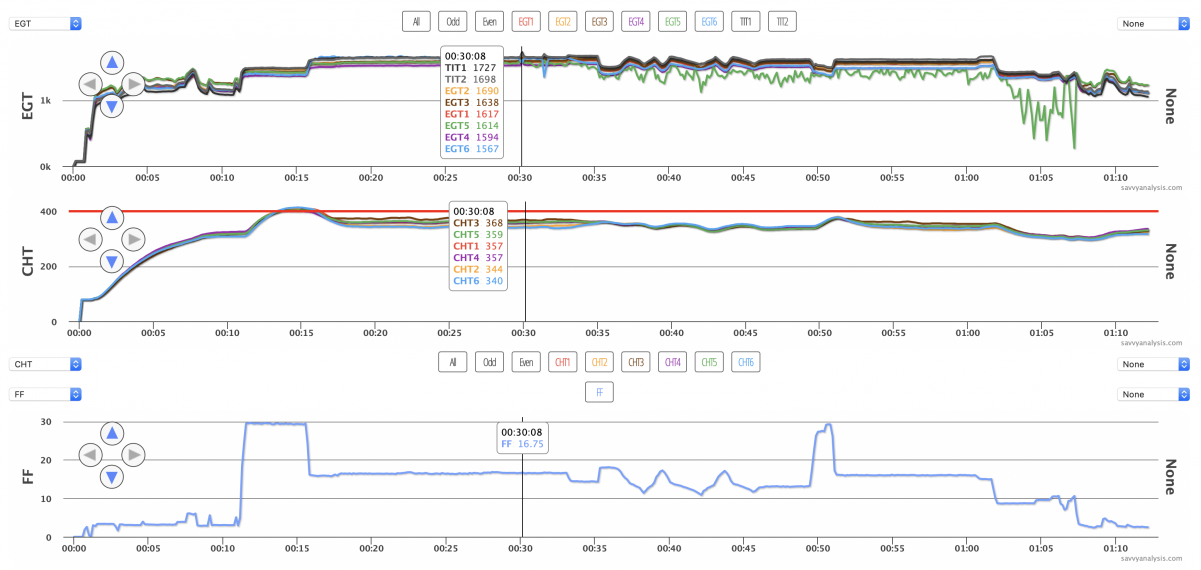
Usually I list the aircraft, engine and data monitor for each sample. I’m going to skip that this time, because – except for this one – it’s not relevant. On this one it is because the data is from a Cirrus SR22T powered by a Continental TSIO-550-K and data from a Garmin G-1000 with a 1 sec sample rate. On this engine RPMs are always 2500. Layout is the default display of EGTs on top, then CHTs, then FF. Cursor is parked on the first of the two EGT rises that define the mag check.
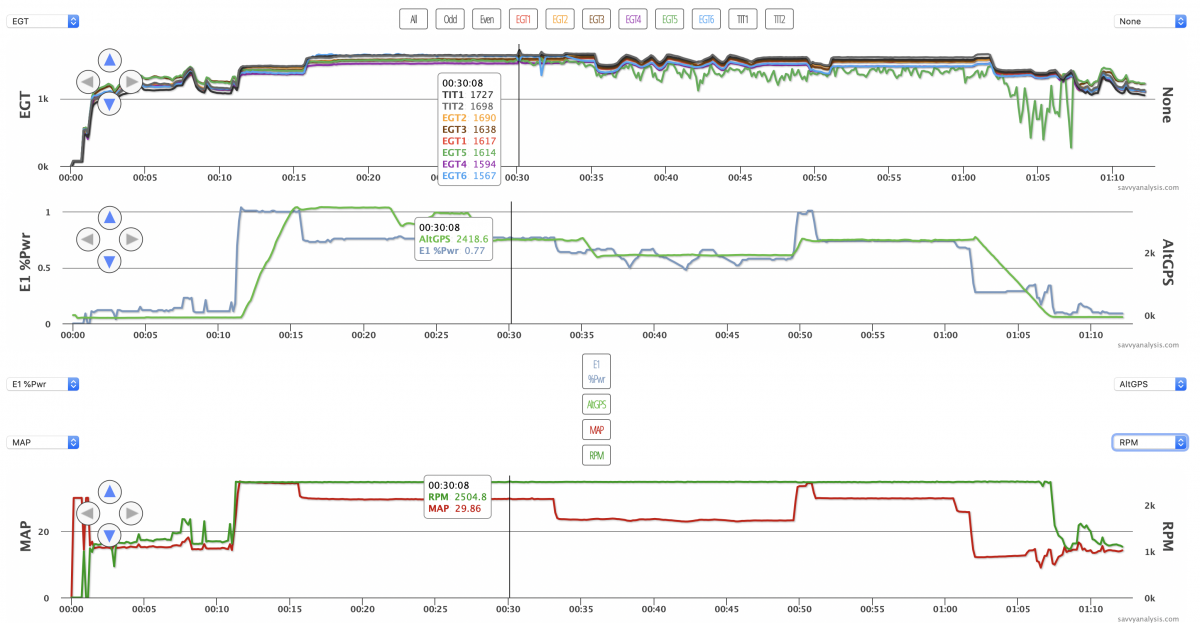
After several years of doing analysis, I have learned to look at FF during the mag check. It’s supposed to be well LOP and remain unchanged during both mag isolations (more about that later.) Here the FF is steady, but it’s high for this engine. So I overlaid %HP, GPS altitude, then MAP and RPMs.
The first two bullet points of the test profile are about power settings.
- For normally aspirated engines: Climb to an altitude that allows 65% power or less at WOT.
- For turbo engines: After picking a MAP and RPM that represents 65% power or less, climb to the altitude where ambient air pressure is very nearly equal to your chosen MAP. (Assume ambient sea level pressure of ~29.92 drops 1” with every 1000 MSL of altitude.)
This is a turbo engine and it looks like that 2nd bullet got missed. On this engine RPM is always 2500, so the power reduction comes from MAP, and 29.86″ is going to give you 77% at 16.5 GPH. Plus the altitude shows 2400 MSL. Like the Hippocratic oath, our goal is to do no harm. Running the mag check – aka the ignition stress test – at 65% power will momentarily elevate EGTs (and TIT/s, if you have it/them) but the data we gather is worth the momentary stress. But running this test at higher than 65% power is a common error.
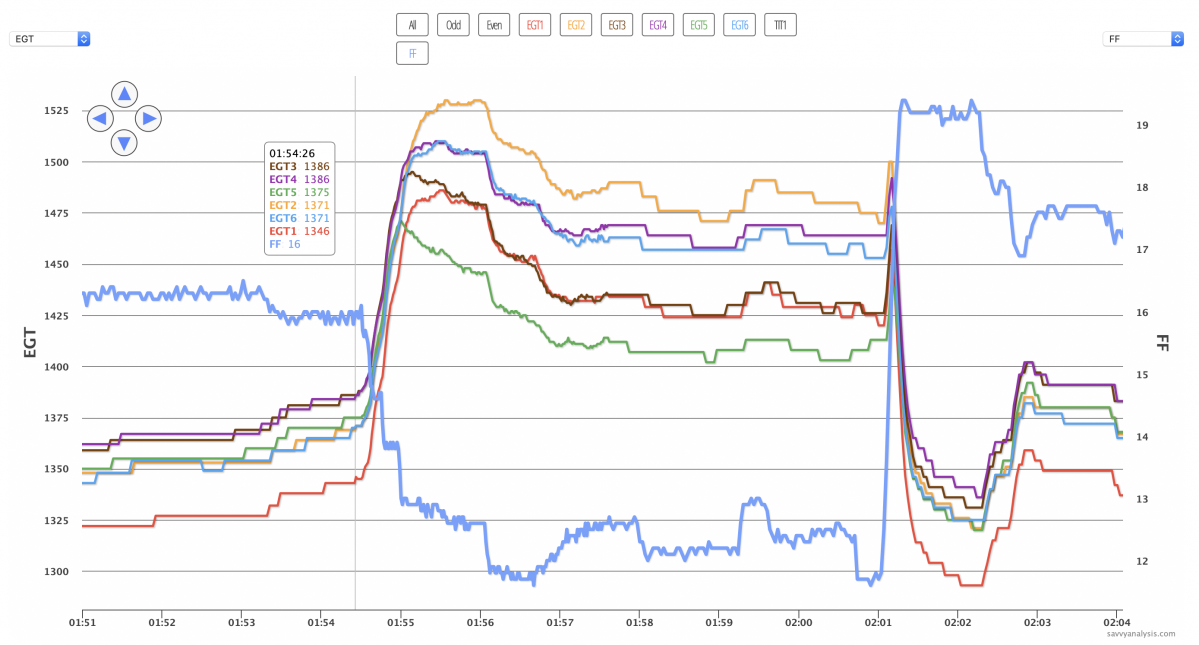
Next up is data from one of the engines of a twin and data from a JPI 760 with a 2 sec sample rate. This is the GAMI layout of EGT and FF.
Two things here; first is stair-stepping in the FF sweep. Start point is ok – end point is ok, but the FF rate of change isn’t constant so the EGT peaks aren’t well-defined. You could say 5 – the green trace – is the exception and does appear to peak first and then drop off. But that’s what we want to see for every trace. Second thing is at 02:01 FF goes from 12 to about 19 GPH in one fell swoop and EGTs drop about 175º. If done according to our recommendations, the rich to lean sweep ends at the onset of roughness by reversing direction back to the ROP starting point. Then you do another full sweep, which should give us enough. Sometimes we see a long series of sweeps – peak after peak. Nothing wrong with that but isn’t necessary. If we get three or four good peaks we can average them and feel confident about the distribution analysis. Nine or ten peaks usually just confirm what the first few already told us.
See the two rises in EGT and FF at 01:57 and 01:59 ? I wonder if that was a mag check at the end of the sweep, although EGTs don’t climb very much. More about that shortly.
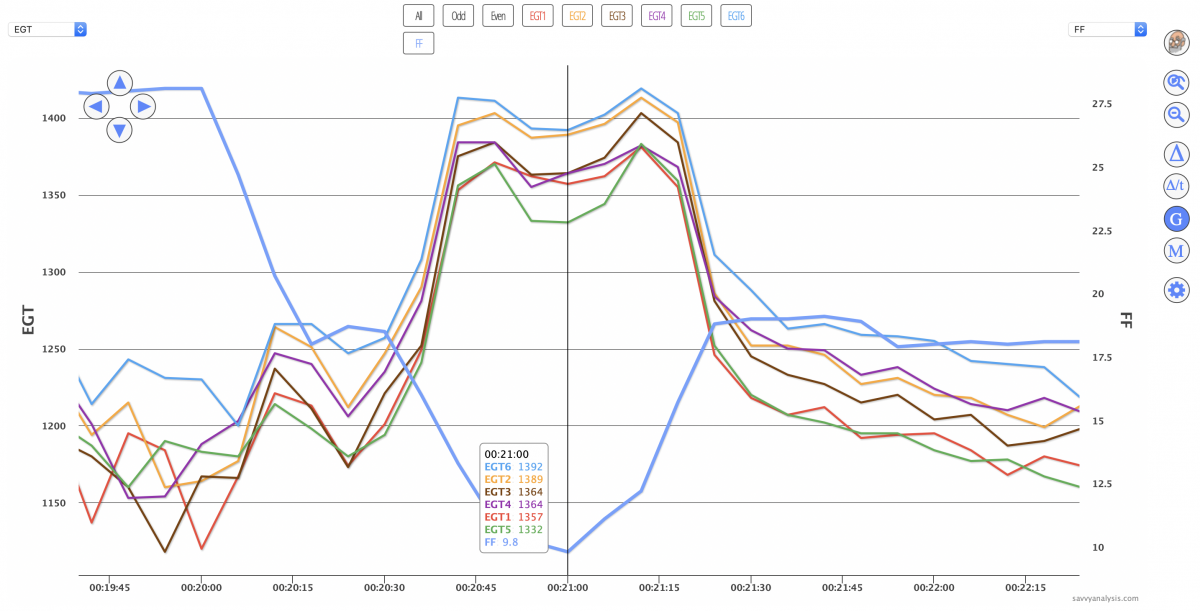
Another problem we see a lot is fast sweeps. Here’s data from a Cirrus SR22 powered by a Continental IO-550 and data from an Avidyne with a 6 sec sample rate. Again it’s the GAMI display of EGT and FF.
Here the FF rate of change is constant, but it’s too fast. FF drops from 17 GPH to 10 GPH is 30 secs. We’ve got some peaks, but we wouldn’t want to draw conclusions from them. And the equally fast lean to rich sweep shows them peaking together, and we don’t believe that either. We get the most reliable data with a constant FF rate of change of about 2 GPH per minute. We know it’s tough to go that slow and tougher still without a vernier control, and it takes twice as long for a twin – but neither of us wants to send you back into the air to gather better data.
That last guy might have been in a hurry, but I think this next guy has him beat. EGTs and FF only.
It looks like he blended the mag check with the mixture sweeps. How else do we explain that EGTs rise about twice as high on the first and last sweep than on the middle one ?
I’m almost positive that’s what happened on this one.
Why else would EGTs 2-4-6 rise to the right of the cursor ?
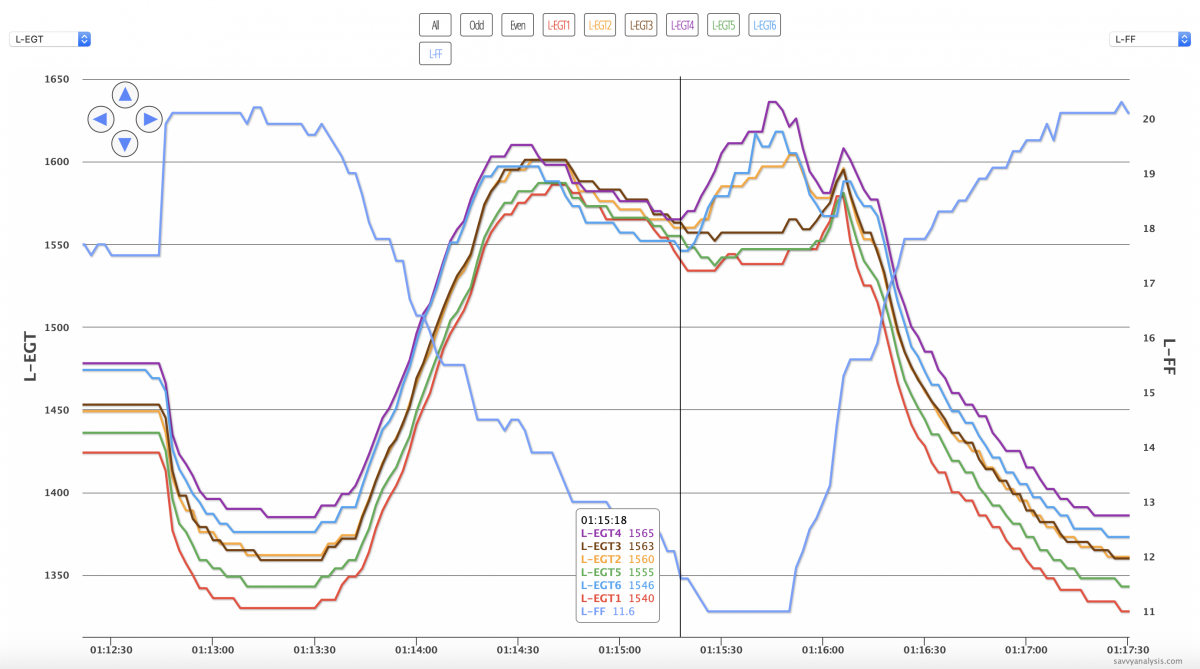
A very common error in mag checks is FF changing during the check. Here’s an example. To save space I combined EGT and FF onto one rank.

If FF changes from one mag to the next, we can’t draw reliable conclusions about mag timing or spark plug health.
To recap —
- For normally aspirated engines: Climb to an altitude that allows 65% power or less at WOT.
- For turbo engines: After picking a MAP and RPM that represents 65% power or less, climb to the altitude where ambient air pressure is very nearly equal to your chosen MAP. (Assume ambient sea level pressure of ~29.92 drops 1” with every 1000 MSL of altitude.)
- Try for a steady FF rate of change from 100º ROP to the onset of roughness – then reverse and use the same rate back to 100º ROP – then repeat
- Another error not depicted above is a perfectly good rich to lean sweep, then the red knob gets fire-walled for the next rich to lean sweep.
- Don’t touch the mags during the FF sweeps, and don’t change FF during the mag checks. They’re separate tests – don’t combine them.
