What gets your attention when you’re flying? Obviously traffic, terrain and weather get your attention, but let’s narrow it down to events or trends in the engine data that would cause you to consider a precautionary landing. High CHT, no or very low CHT, ditto those for EGT and TIT for sure, especially if the data is corroborated by rough running or poor performance. But there’s one that can show up without a lot of fanfare but can nonetheless change your plans — abnormal oil temperature.
When the colder ambient temps arrived for most US-based Savvy clients last Fall, we got questions about oil temp. Many were on the order of “If my oil temp never got above 180º on this flight, how can I be sure I’m burning the moisture out of the oil?”
Before we’re able to pronounce a given reading too low, it helps to know where that reading came from. If the sensor is located just ahead of the oil cooler, then we’re probably seeing the highest temperature in the circuit. If it’s just behind the cooler, we might be seeing the coolest point in the circuit. That’s where temperature probes are located on most engines we analyze, but if you’re doing your own analysis take the sensor location into consideration in your calculations.
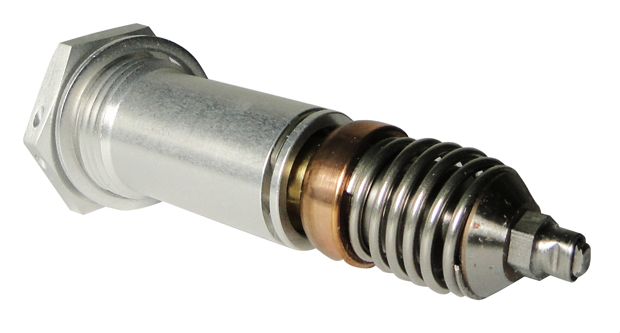
Oil always passes through the filter (or screen) but only passes through the cooler when it “needs to”, and that’s determined by the Vernatherm – a temperature-activated spring-loaded valve.
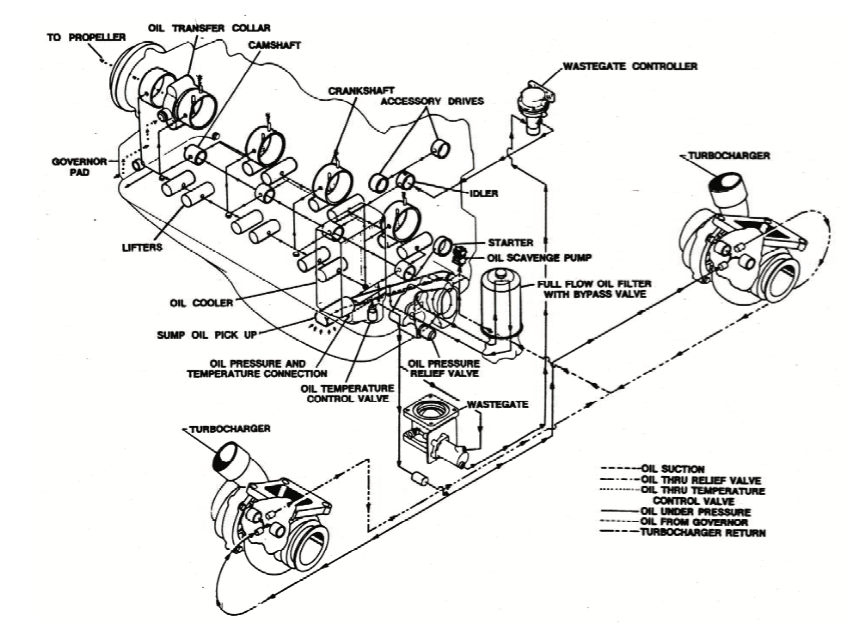
Here’s the oil temperature control valve (lower center) in context of the oil system for a TSIO-550-N Tornado Alley Turbo on an SR22. Our point of view is the left rear of the engine, so – unlike many big-bore Continentals – the oil cooler is in the back.
Let’s take a look at the engine data – the bold yellow trace is oil temp.
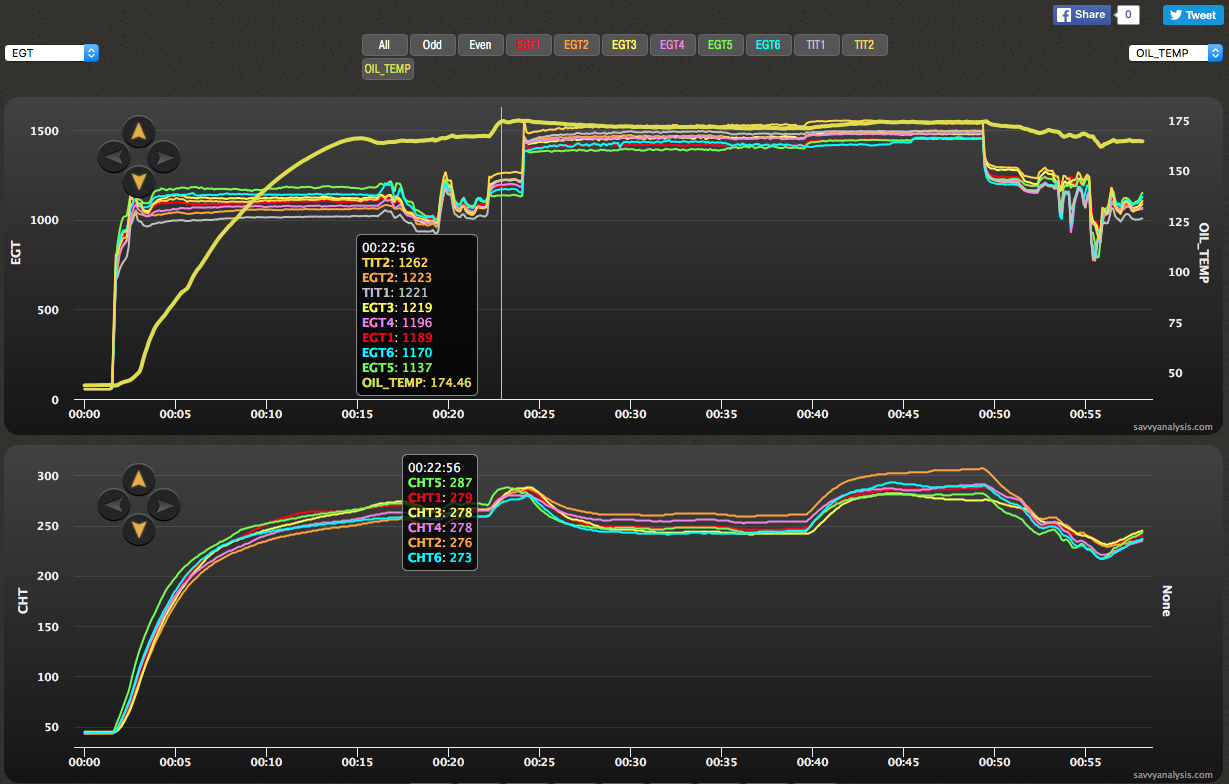
Oil heats up, reaches 174.46º, the spring does its job and keeps oil moving through the cooler as necessary to maintain that range. If you’re flying, chances are nothing here has you thinking about a precautionary landing. Full disclosure — this data is from a flight after the faulty Vernatherm was replaced.
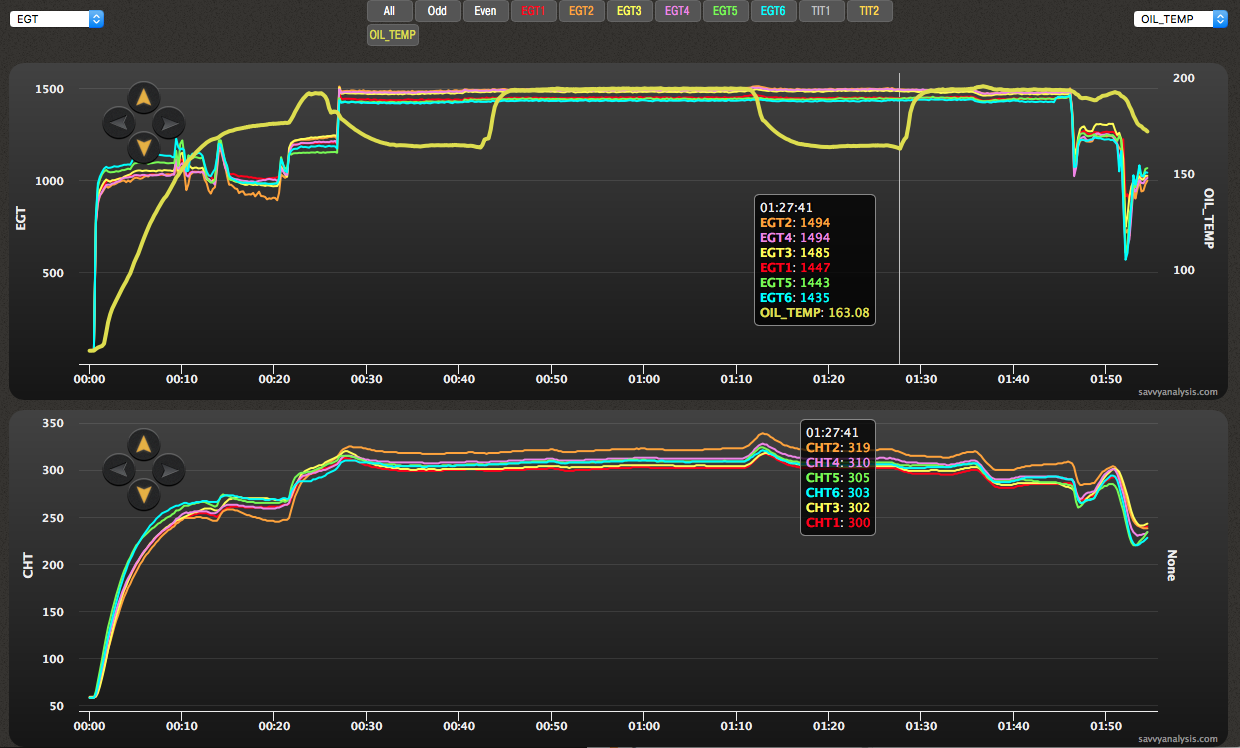
Here’s data from the previous flight.
“I Go To Extremes”
When you consider the universe of failure modes for a spring-loaded valve, it can fail fully closed, or fully open, be completely erratic, or follow the Billy Joel song and open and close at the extremes of its range. That’s what happens here – in the 194 range it opens the path to the cooler, and it stubbornly stays open until oil is cooled to 163, then closes again, sending oil temps back to about 194.
If this is your flight, you’ve climbed and leveled off in cruise, you’re used to seeing oil temp in the 175 range and now it’s 190+, that probably gets your attention. It’s not quite “declare an emergency” time, but you’re probably wondering why it’s higher and will it go higher than this? As you perform the big mixture pull, it doesn’t go higher, in fact it drops quickly to the 165 range. Now you’re wondering, why is it lower and will it go lower than this? Meanwhile, oil pressure is steady and normal. EGTs and CHTs look stable and where you’re used to seeing them for this power setting.
This flight continued as planned, but when he landed, the owner uploaded the data and requested analysis – specifically oil temp. Our first question was “can we trust the data?” Is it an accurate representation of oil temp or is it a sensor malfunction? The first clue is that it happens twice and the patterns look very similar, right down to the little drop before the big climb. That’s an argument for accurate data and against sensor malfunction. There’s another clue we get by zooming in.
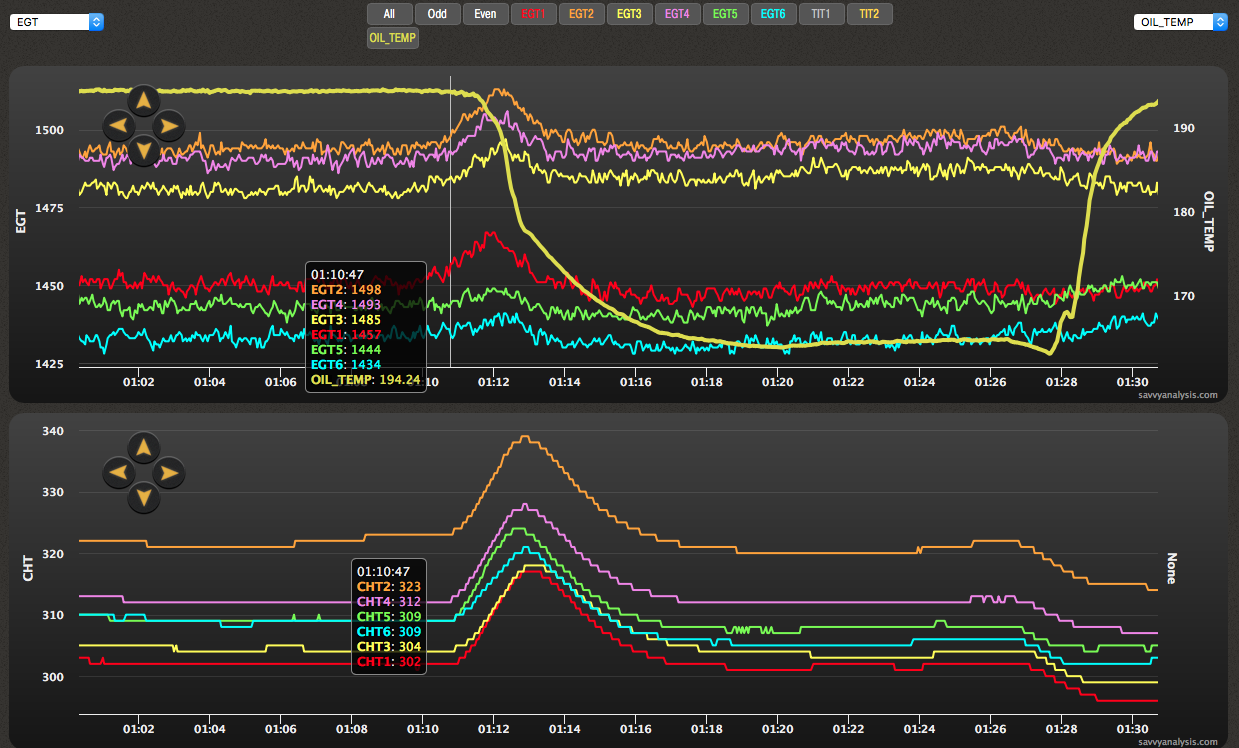
At about 01:10 into the flight, right before the oil temp drops, EGTs and CHTs start to rise. We probably wouldn’t see that if it’s an oil temp sensor malfunction and oil temp is actually steady. There are no spikes to impossible numbers – like zero and 500º – which also points away from sensor malfunction or loose connection. So in this case it looks like we can trust the data which pointed to a faulty oil temperature control valve, and – as you’ve already seen – replacing it returned the oil temp into the normal range.
Consensus is that 175-180º at the sensor means oil was probably 212º or better at some point in the circuit – enough to burn off the moisture that collects when engines aren’t making power.
Here’s data from a mid-February flight of a Cessna 182 with a Continental 0-470 engine. OAT is about 40 º. Oil temp is the bold yellow trace.

Oil temp peaks at 145º, drops twice into the 100-110 range, and settles in about 120. It’s a harder case to make that oil got up to 212º at some point in the circuit. The oil cooler is in front, the sensor is at the cooler, the case is smaller, and this engine doesn’t have twin turbos adding to the heat.
On the SR22, even when oil was peaking in the 190 range, CHTs were 320º and below. On this 470, with oil at 145º, CHTs are 350-400º. Is there a connection between those high CHTs and low oil temp?
Oil temp at takeoff was about 90º – granted it was climbing, but still only about 90 during the roll. If oil is still congealed, it can’t perform its cooling function as well as it should.
Now that we’ve seen extremes and too low, let’s close this month with data from a TSIO-520 on a Cessna 210. Oil temp is once again yellow, but I didn’t bold it so you can see the small movements in the trace.

This is, as Goldilocks might say – just right. Oil temp is about 150º at takeoff, warm enough to be circulating and performing its cooling and lubrication duties. It peaks at 194º, not a rock-solid guarantee that it got to 212º at some point, but a pretty good bet. In cruise it settles in around 185 and the trace is stable.
Altitude isn’t logged on this JPI 700 but the EGT pattern suggests takeoff, power reduction for climb, lower EGTs at the cursor could be an enroute climb, then the big pull around the 36 min mark. The 2-3º sawtooth pattern in oil temp during the climb could suggest a weak connection, but since we see less of that pattern later in the flight, more likely suggests the oil temperature control valve spring doing its job.